The production of $\phi$ mesons has been studied in pp collisions at LHC energies with the ALICE detector via the dimuon decay channel in the rapidity region $2.5 <~ y <~ 4$. Measurements of the differential cross section ${\rm d}^2\sigma/{\rm d}y {\rm d}p_{\rm T}$ are presented as a function of the transverse momentum ($p_{\rm T}$) at the center-of-mass energies $\sqrt{s}=5.02$, 8 and 13 TeV and compared with the ALICE results at midrapidity. The differential cross sections at $\sqrt{s}=5.02$ and 13 TeV are also studied in several rapidity intervals as a function of $p_{\rm T}$, and as a function of rapidity in three $p_{\rm T}$ intervals. A hardening of the $p_{\rm T}$-differential cross section with the collision energy is observed, while, for a given energy, $p_{\rm T}$ spectra soften with increasing rapidity and, conversely, rapidity distributions get slightly narrower at increasing $p_{\rm T}$. The new results, complementing the published measurements at $\sqrt{s}=2.76$ and 7 TeV, allow one to establish the energy dependence of $\phi$ meson production and to compare the measured cross sections with phenomenological models. None of the considered models manages to describe the evolution of the cross section with $p_{\rm T}$ and rapidity at all the energies.
Eur. Phys. J. C 81 (2021) 772
HEP Data
e-Print: arXiv:2105.00713 | PDF | inSPIRE
CERN-EP-2021-057
Figure group
Figure 1
Examples of fits to the invariant mass spectra with the hadronic cocktail in pp collisions at √s = 5.02, 8 and 13 TeV, for muon pairs in 2.5 < y < 4. The red histograms represent the sum of all simulated contributions. The correlated continuum has been fitted with a variable-width Gaussian function |  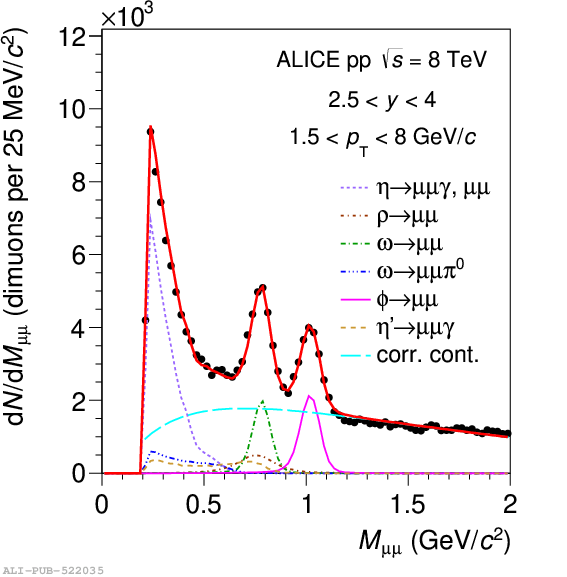 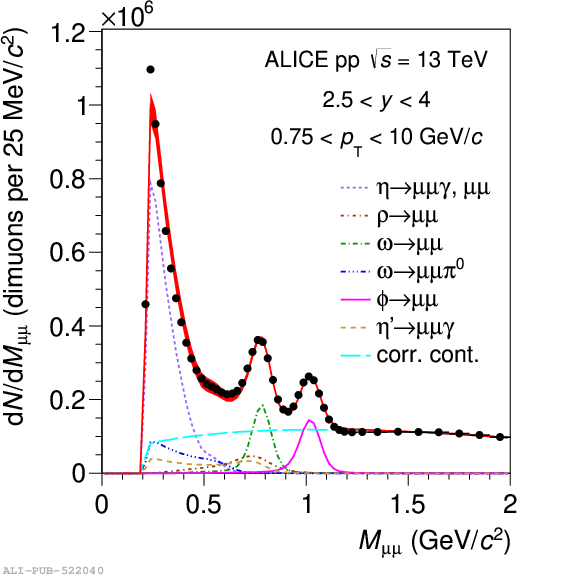 |
Figure 2
Differential $\phi$ meson production cross section $\mathrm{d}^2\sigma/(\mathrm{d}y\mathrm{d}\pt)$ as a function of $\pt$ at $\sqrt{s}=5.02$ TeV, $\sqrt{s}=8$ TeV and $\sqrt{s}=13$ TeV, measured in the $\mu^+\mu^-$ decay channel in the rapidity interval $2.5< y< 4$ (full symbols) and in the K$^+$K$^-$ channel at midrapidity (open symbols). The boxes represent the systematic uncertainties, the error bars the statistical uncertainties. The data points are fitted with a Levy-Tsallis function. The ratio between the fit function at forward rapidity and the data at midrapidity is plotted in the bottom panels. | 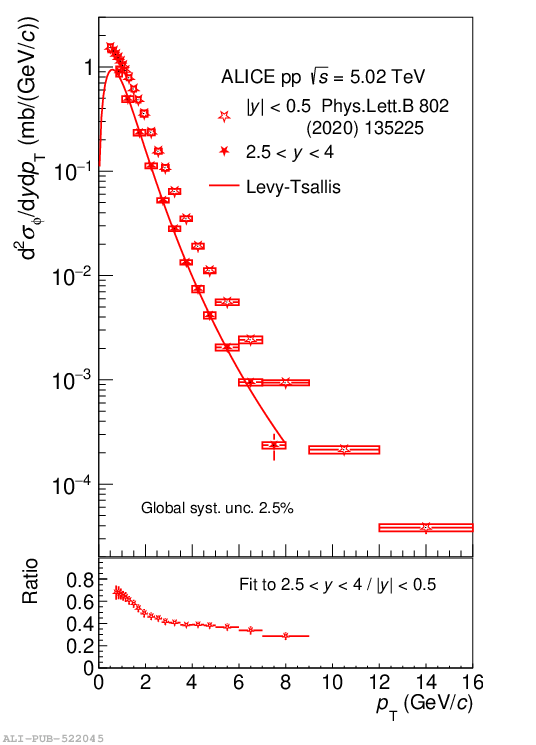 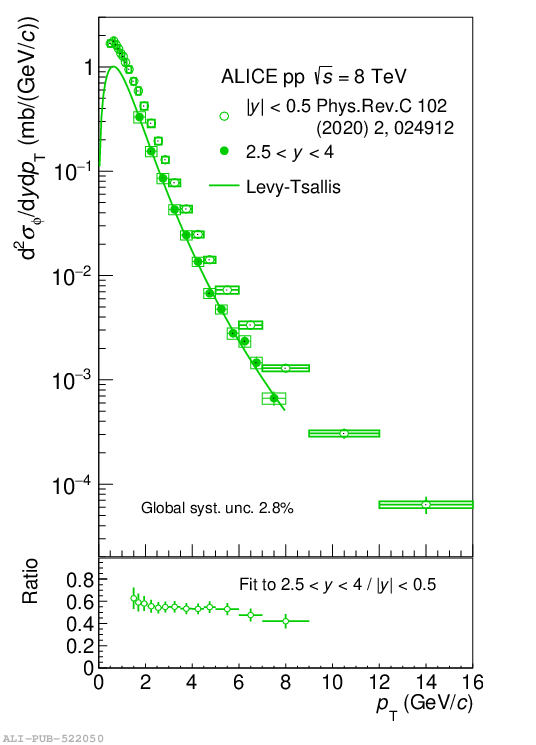 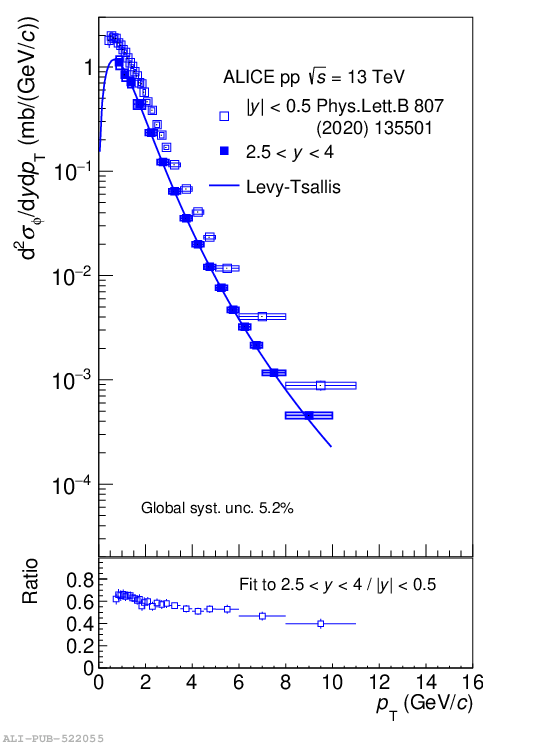 |
Figure 3
Top: differential $\phi$ meson production cross section $\mathrm{d}^2\sigma/(\mathrm{d}y\mathrm{d}\pt$) as a function of $\pt$ at $\sqrt{s}=$2.76, 5.02, 7, 8 and 13 TeV The boxes represent the systematic uncertainties, the error bars the statistical uncertainties. Bottom: ratio between the cross sections measured at several energies to the one obtained at $\sqrt{s}=13$ TeV. | 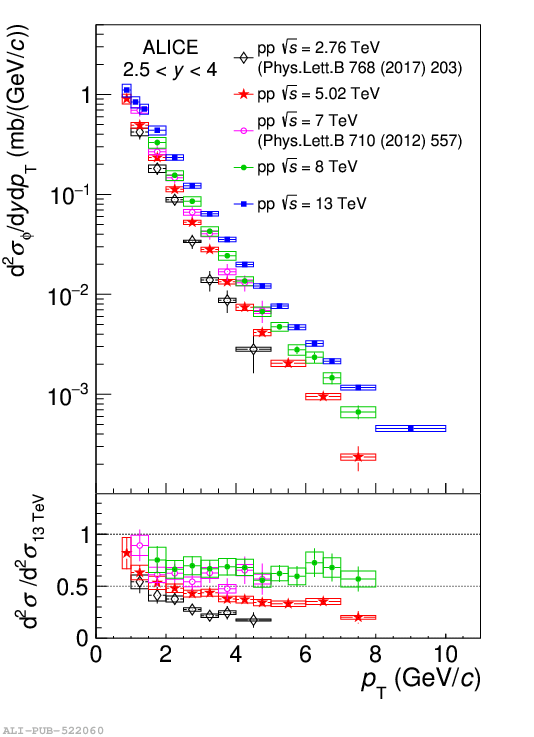 |
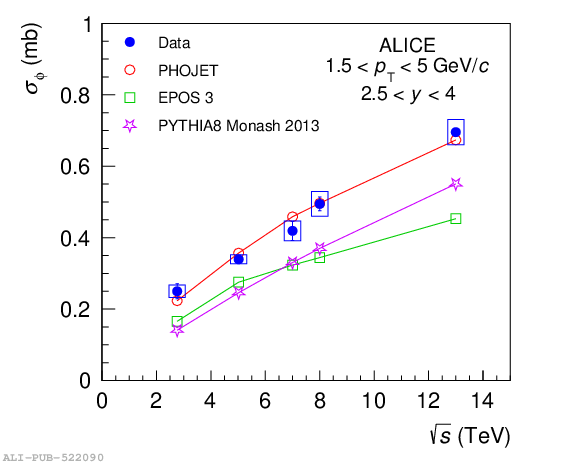
Figure 4
op: differential φ meson production cross section d2σ /dydpT as a function of pT at √s = 5.02 TeV (left), √s = 8 TeV (center) and √s = 13 TeV (right) in the rapidity interval 2.5 < y < 4, compared with EPOS 3 [8–10], PHOJET [6, 7] and the Monash 2013 tune of PYTHIA 8.1 [1]. The boxes represent the systematic uncertainties, the error bars the statistical uncertainties. Bottom: ratio between the measured cross section and the calculations. | 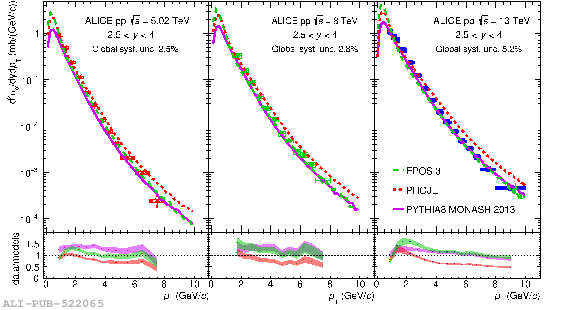 |
Figure 5
Differential $\phi$ meson production cross section $\mathrm{d}^2\sigma/\mathrm{d}y\mathrm{d}\pt$ as a function of $\pt$ at $\sqrt{s}=5.02$ TeV (left) and $\sqrt{s}=13$ TeV (right) in several rapidity intervals. The boxes represent the systematic uncertainties, the error bars the statistical uncertainties Data are fitted with a Levy-Tsallis function. | 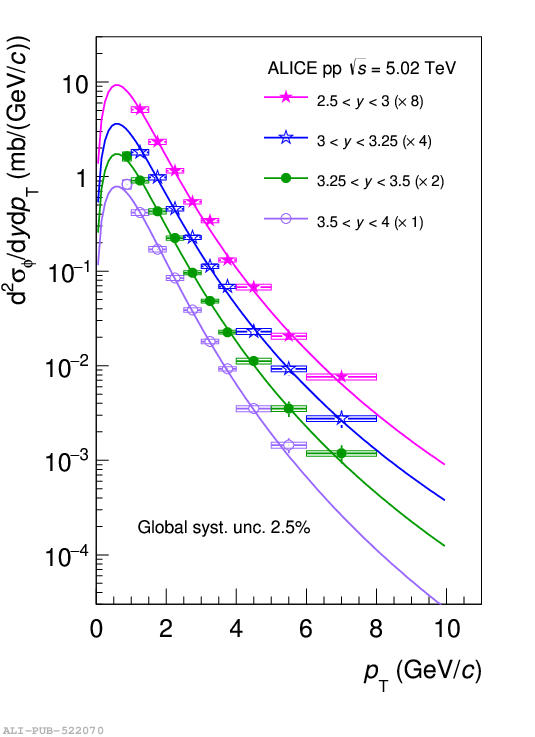 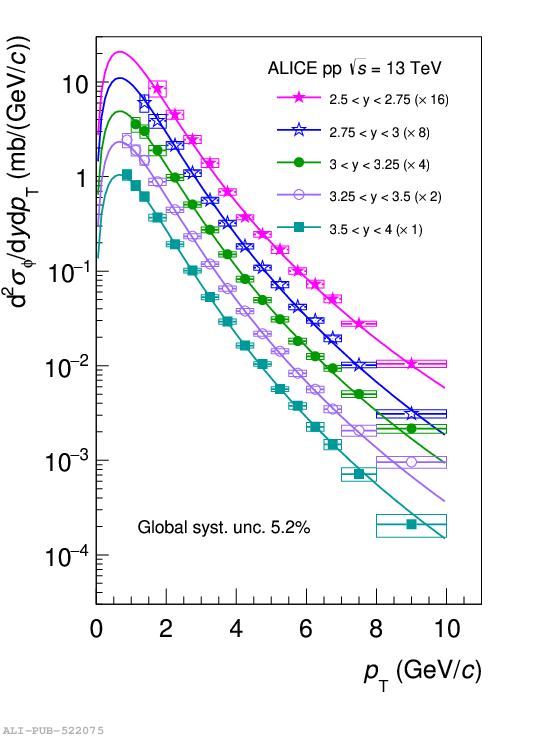 |
Figure 6
Differential $\phi$ meson production cross section $\mathrm{d}^2\sigma/\mathrm{d}y\mathrm{d}\pt$ as a function of rapidity at $\sqrt{s}=5.02$ TeV (left) and $\sqrt{s}=13$ TeV (right) in several $\pt$ intervals, compared with EPOS 3 , PHOJET and the Monash 2013 tune of PYTHIA 8.1 . The ratio of the data to the lowest $\pt$ interval is shown in the bottom panel The boxes represent the systematic uncertainties, the error bars the statistical uncertainties | 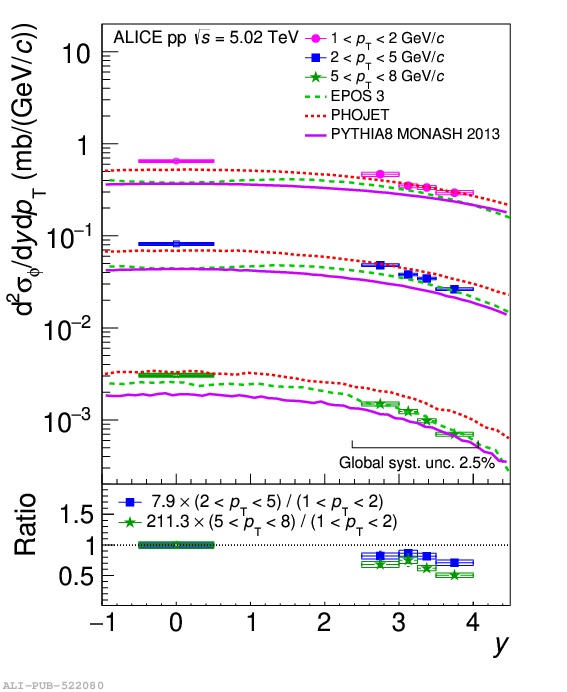 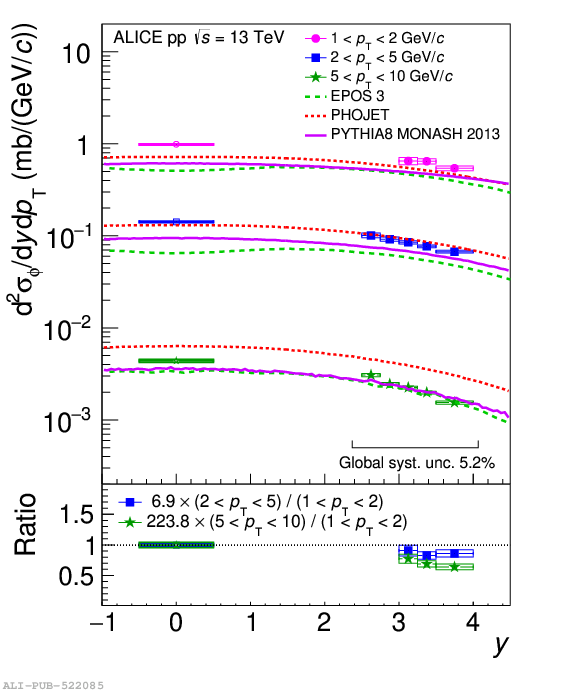 |