The upper panel shows the $\pt$ distribution of $\Ls$ in p--Pb collisions at \mbox{$\sn$ $\mathrm{=}$ 5.02 TeV} in the 0--20\% (red) and 40--60\% (blue) multiplicity intervals. The dashed curves represent predictions from the Blast-Wave model , where the parameters are obtained from simultaneous fits to $\pi^{\pm}$, K$^{\pm}$, K$_{\rm{S}}^{0}$, p($\overline{\rm p}$) and $\Lam$($\overline{\Lam}$) $\pt$ spectra and the shapes are normalized to the data. The lower panel shows the ratios of the measured distributions to the values from the respective Blast-Wave functions. The statistical uncertainties are shown as bars and the systematic uncertainties are shown as boxes. | 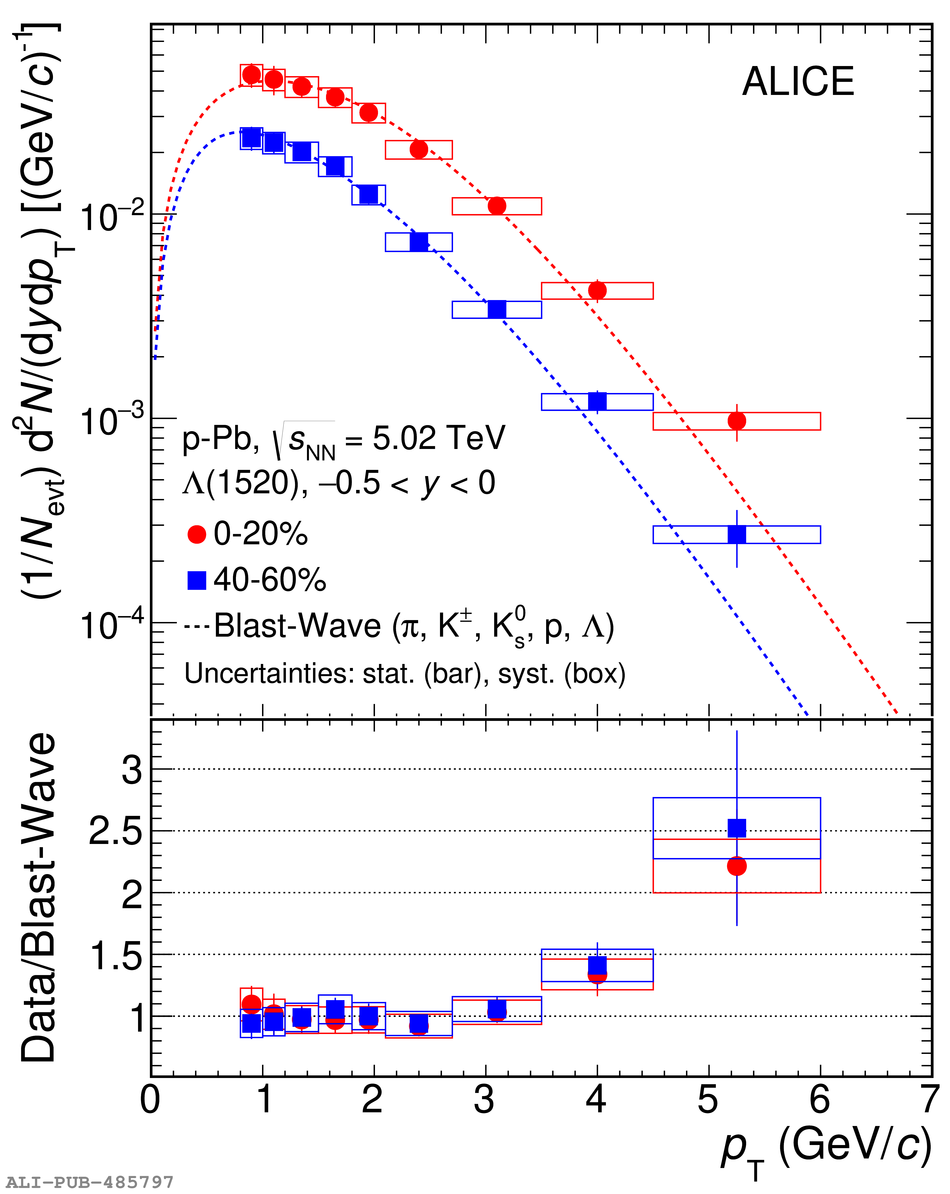 |