Upper panels shows the $\pT$ spectra of $\ks$ and $\ph $ in inelastic pp collisions at 7 TeV (left) and 8 TeV (right) and fitted with the L\'evy-Tsallis distribution . The normalization uncertainty in the spectra is $^{+7.3}_{-3.5}$\% for 7 TeV and 2.69\% for 8 TeV. The vertical bars show statistical and the boxes show systematic uncertainties. The lower panels show the ratio of data to the L\'evy-Tsallis fit. Here, the bars show the systematic uncertainty. | 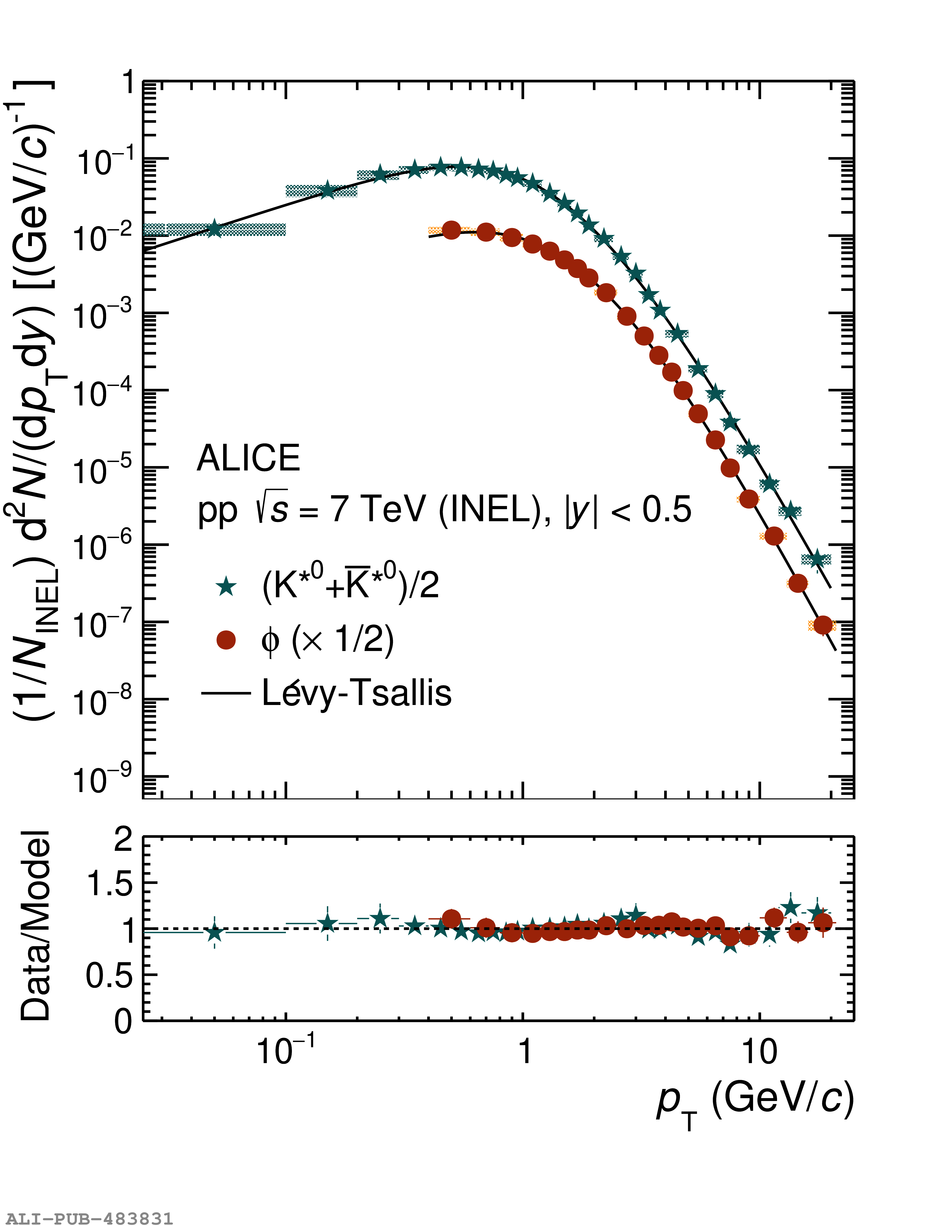 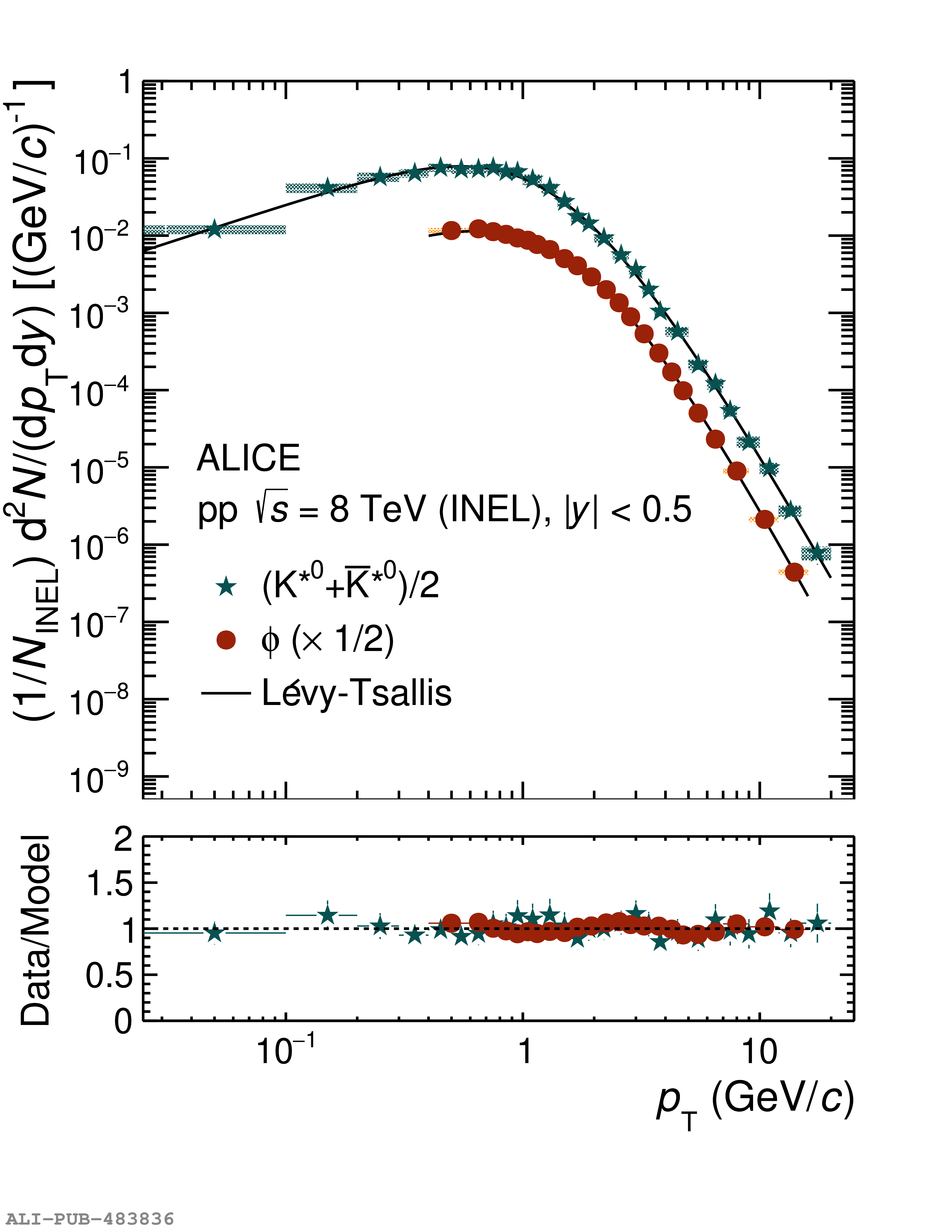 |