Source radius $r_{\textrm{core}}$ as a function of $\langle\mt\rangle$ for the assumption of a Gaussian source with added resonances. The blue crosses result from fitting the \pP correlation function with the strong Argonne $v_{18}$ potential. The green squared crosses (red diagonal crosses) result from fitting the \pL correlation functions with the strong $\chi$EFT LO (NLO ) potential. Statistical (lines) and systematic (boxes) uncertainties are shown separately. | 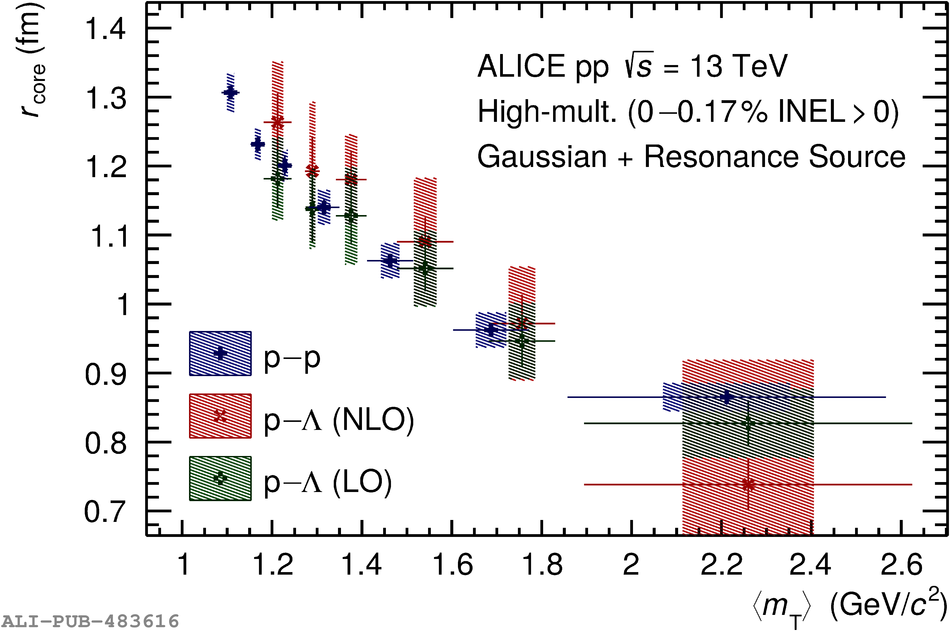 |