Understanding the production mechanism of light (anti)nuclei is one of the key challenges of nuclear physics and has important consequences for astrophysics, since it provides an input for indirect dark-matter searches in space. In this paper, the latest results about the production of light (anti)nuclei in pp collisions at $\sqrt{s} = 13$ TeV are presented, focusing on the comparison with the predictions of coalescence and thermal models. For the first time, the coalescence parameters $B_2$ for deuterons and $B_3$ for helions are compared with parameter-free theoretical predictions that are directly constrained by the femtoscopic measurement of the source radius in the same event class. A fair description of the data with a Gaussian wave function is observed for both deuteron and helion, supporting the coalescence mechanism for the production of light (anti)nuclei in pp collisions. This method paves the way for future investigations of the internal structure of more complex nuclear clusters, including the hypertriton.
JHEP 01 (2022) 106
HEP Data
e-Print: arXiv:2109.13026 | PDF | inSPIRE
CERN-EP-2021-194
Figure group
Figure 1
Transverse-momentum spectra of (anti)protons, (anti)deuterons, (anti)helion, and (anti)triton, measured in HM and MB pp collisions at $\sqrt{s} = $13 TeV at midrapidity ($|y| < 0.5)$. The results are shown in the multiplicity classes reported in Tab. \ref{tab:multiplicity}. Vertical bars and boxes represent statistical and systematic uncertainties, respectively. The dashed lines are individual fits with a L\'evy-Tsallis function. | 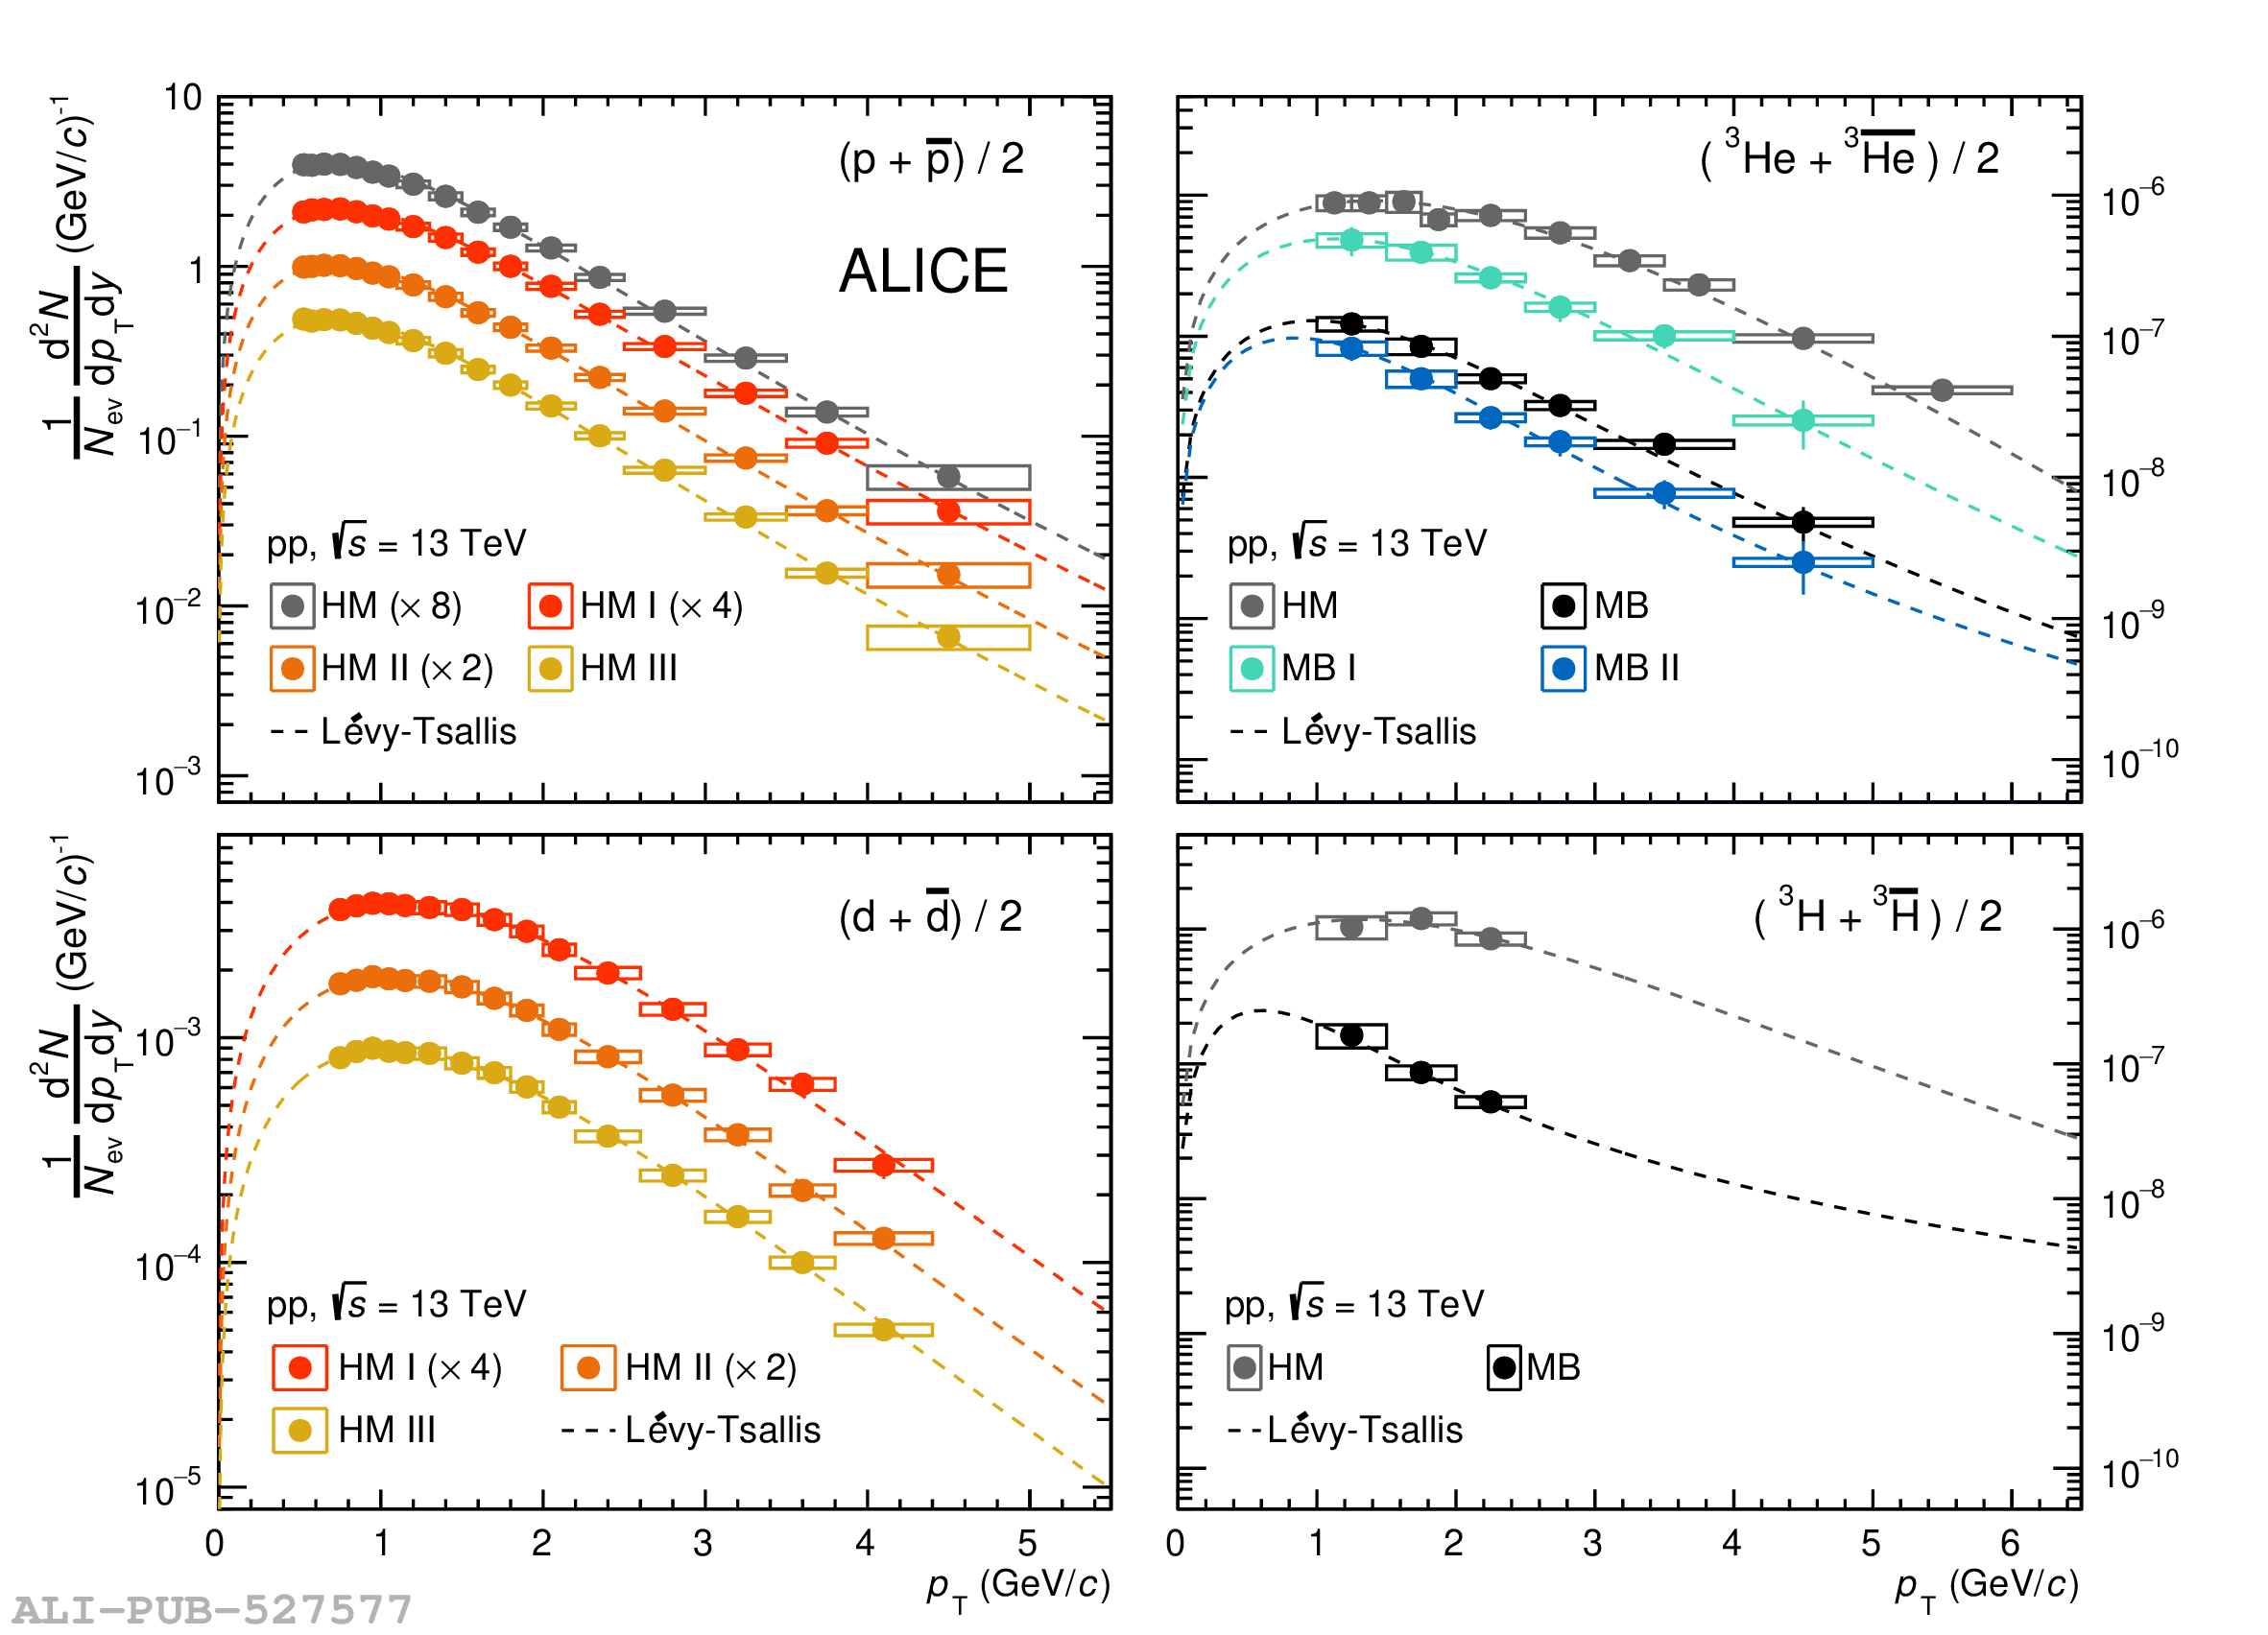 |
Figure 2
(Anti)deuterons. (Anti)helions. Coalescence parameters $B_{2}$ (a) and $B_{3} $ (b) as a function of $p_{\mathrm{T}}/A$ for the multiplicity classes reported in Tab. \ref{tab:multiplicity}. Vertical bars and boxes represent statistical and systematic uncertainties, respectively. | 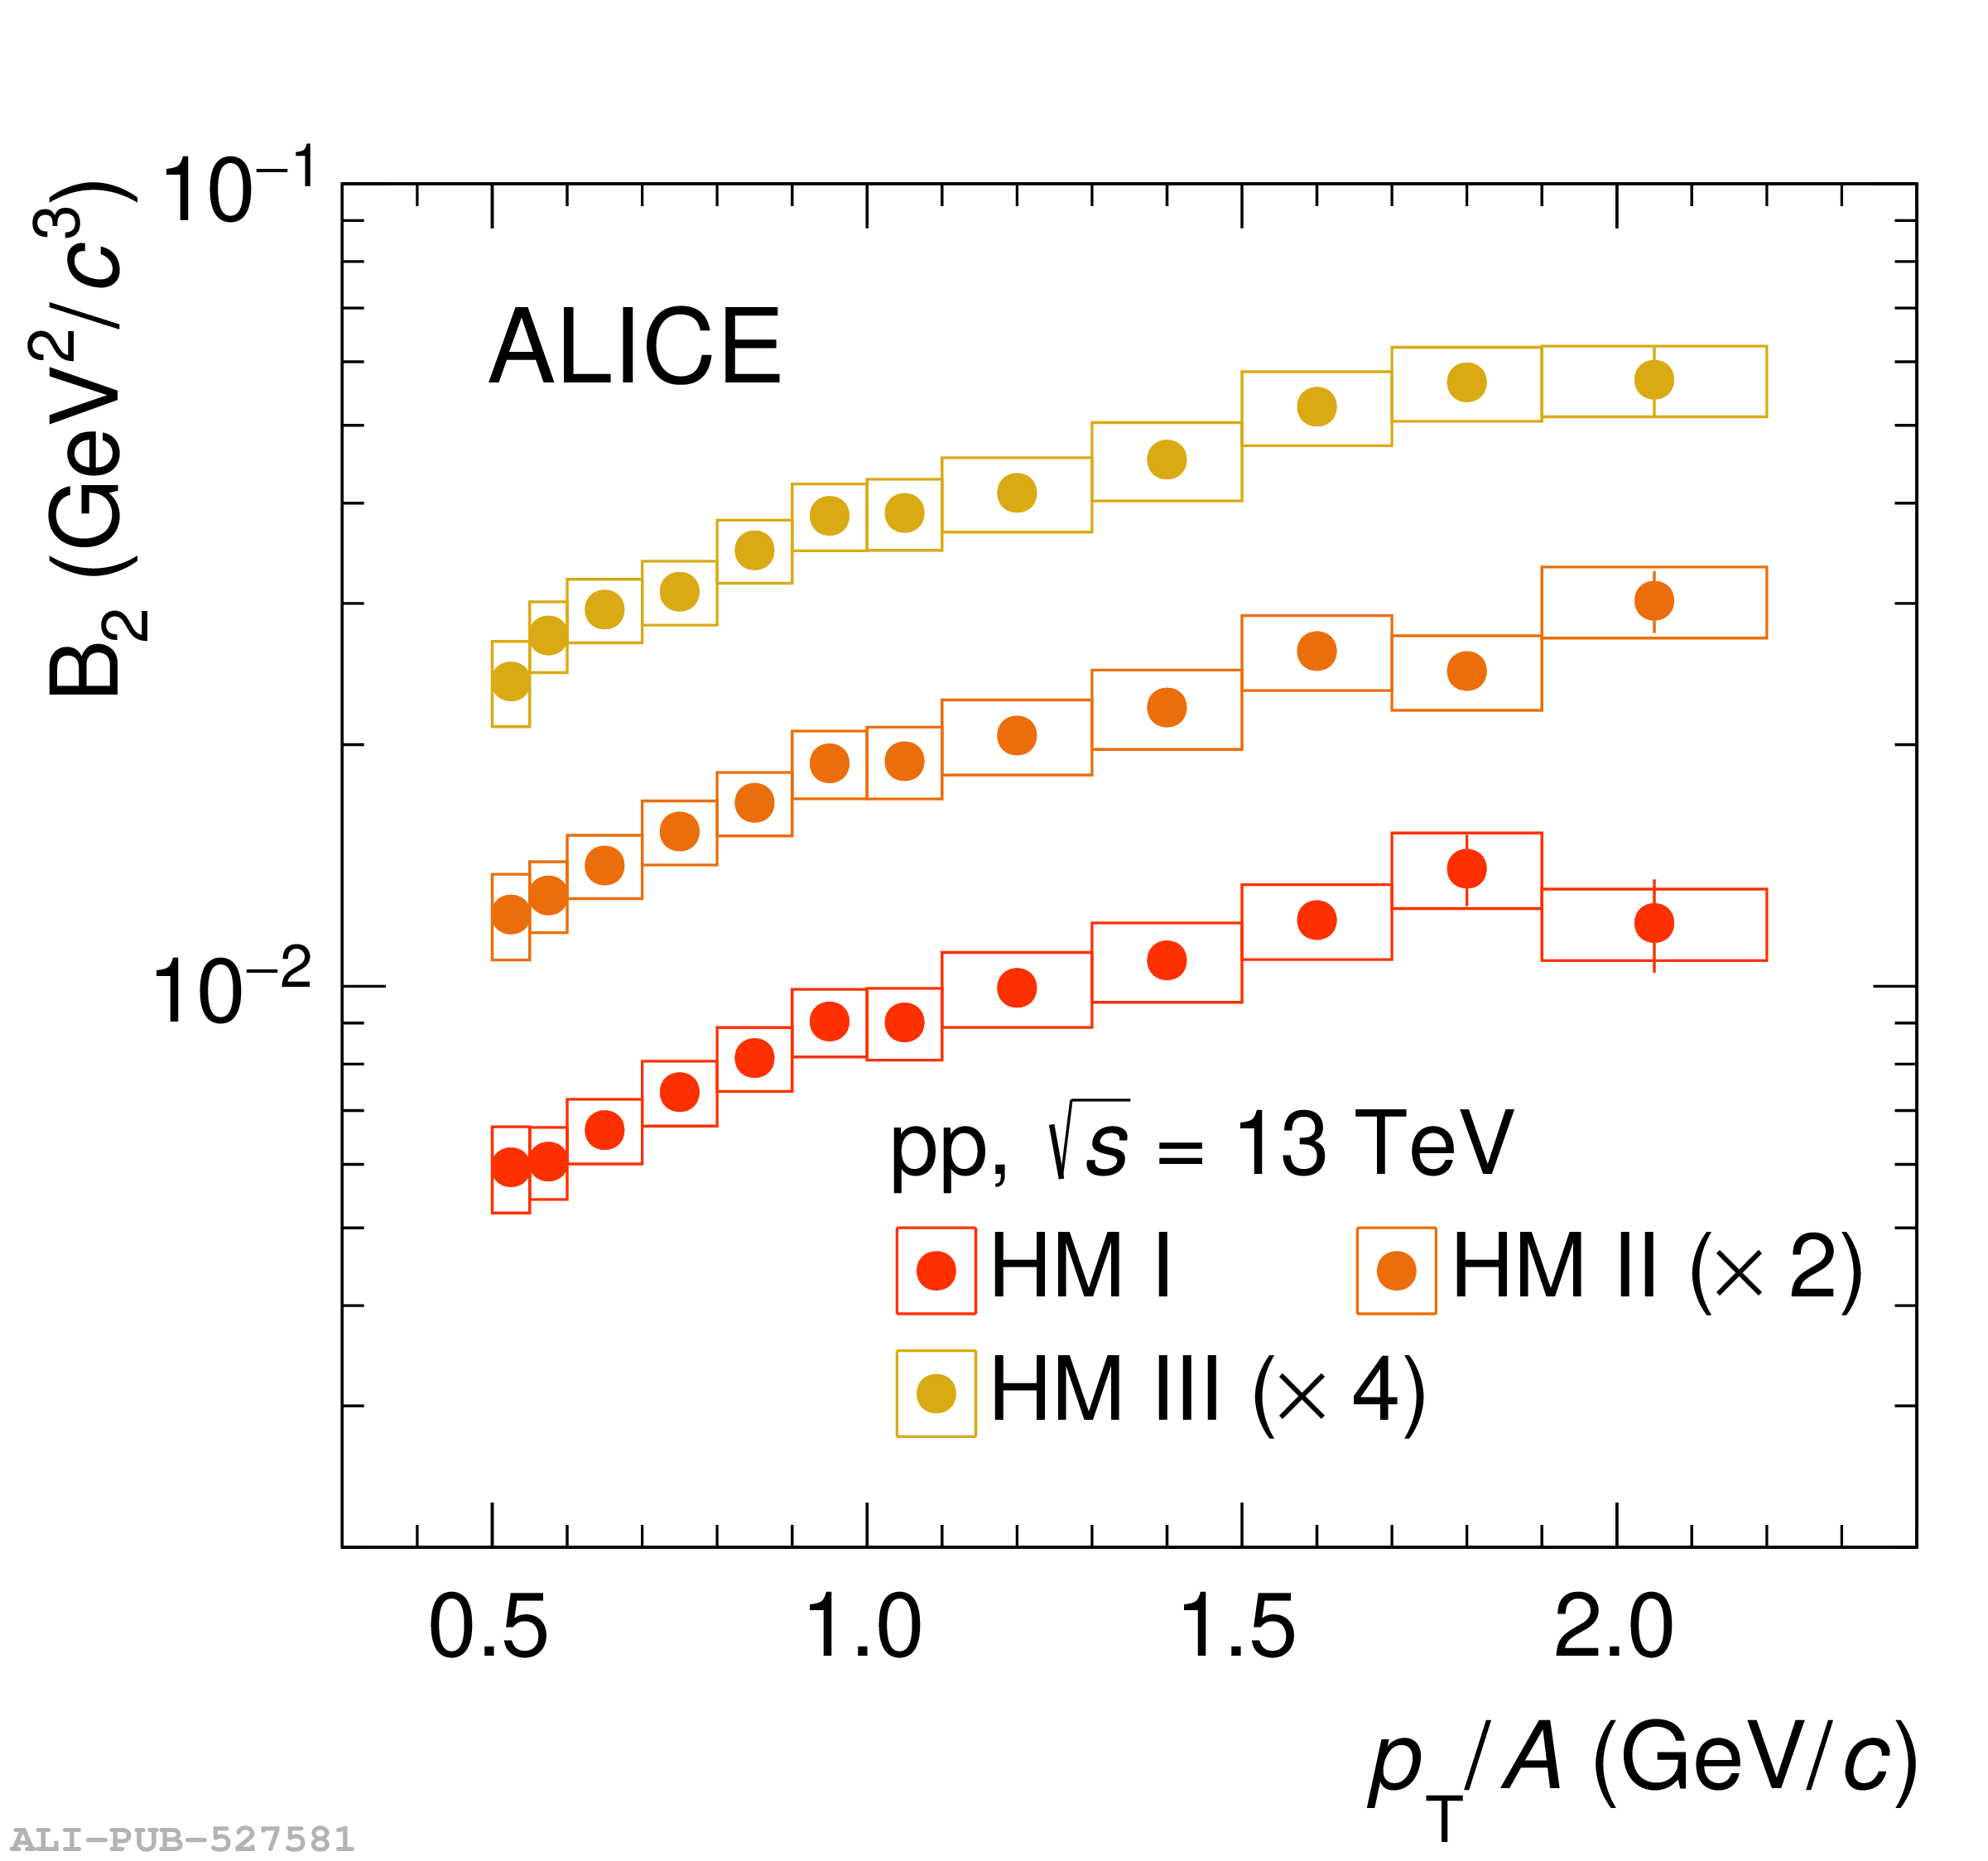 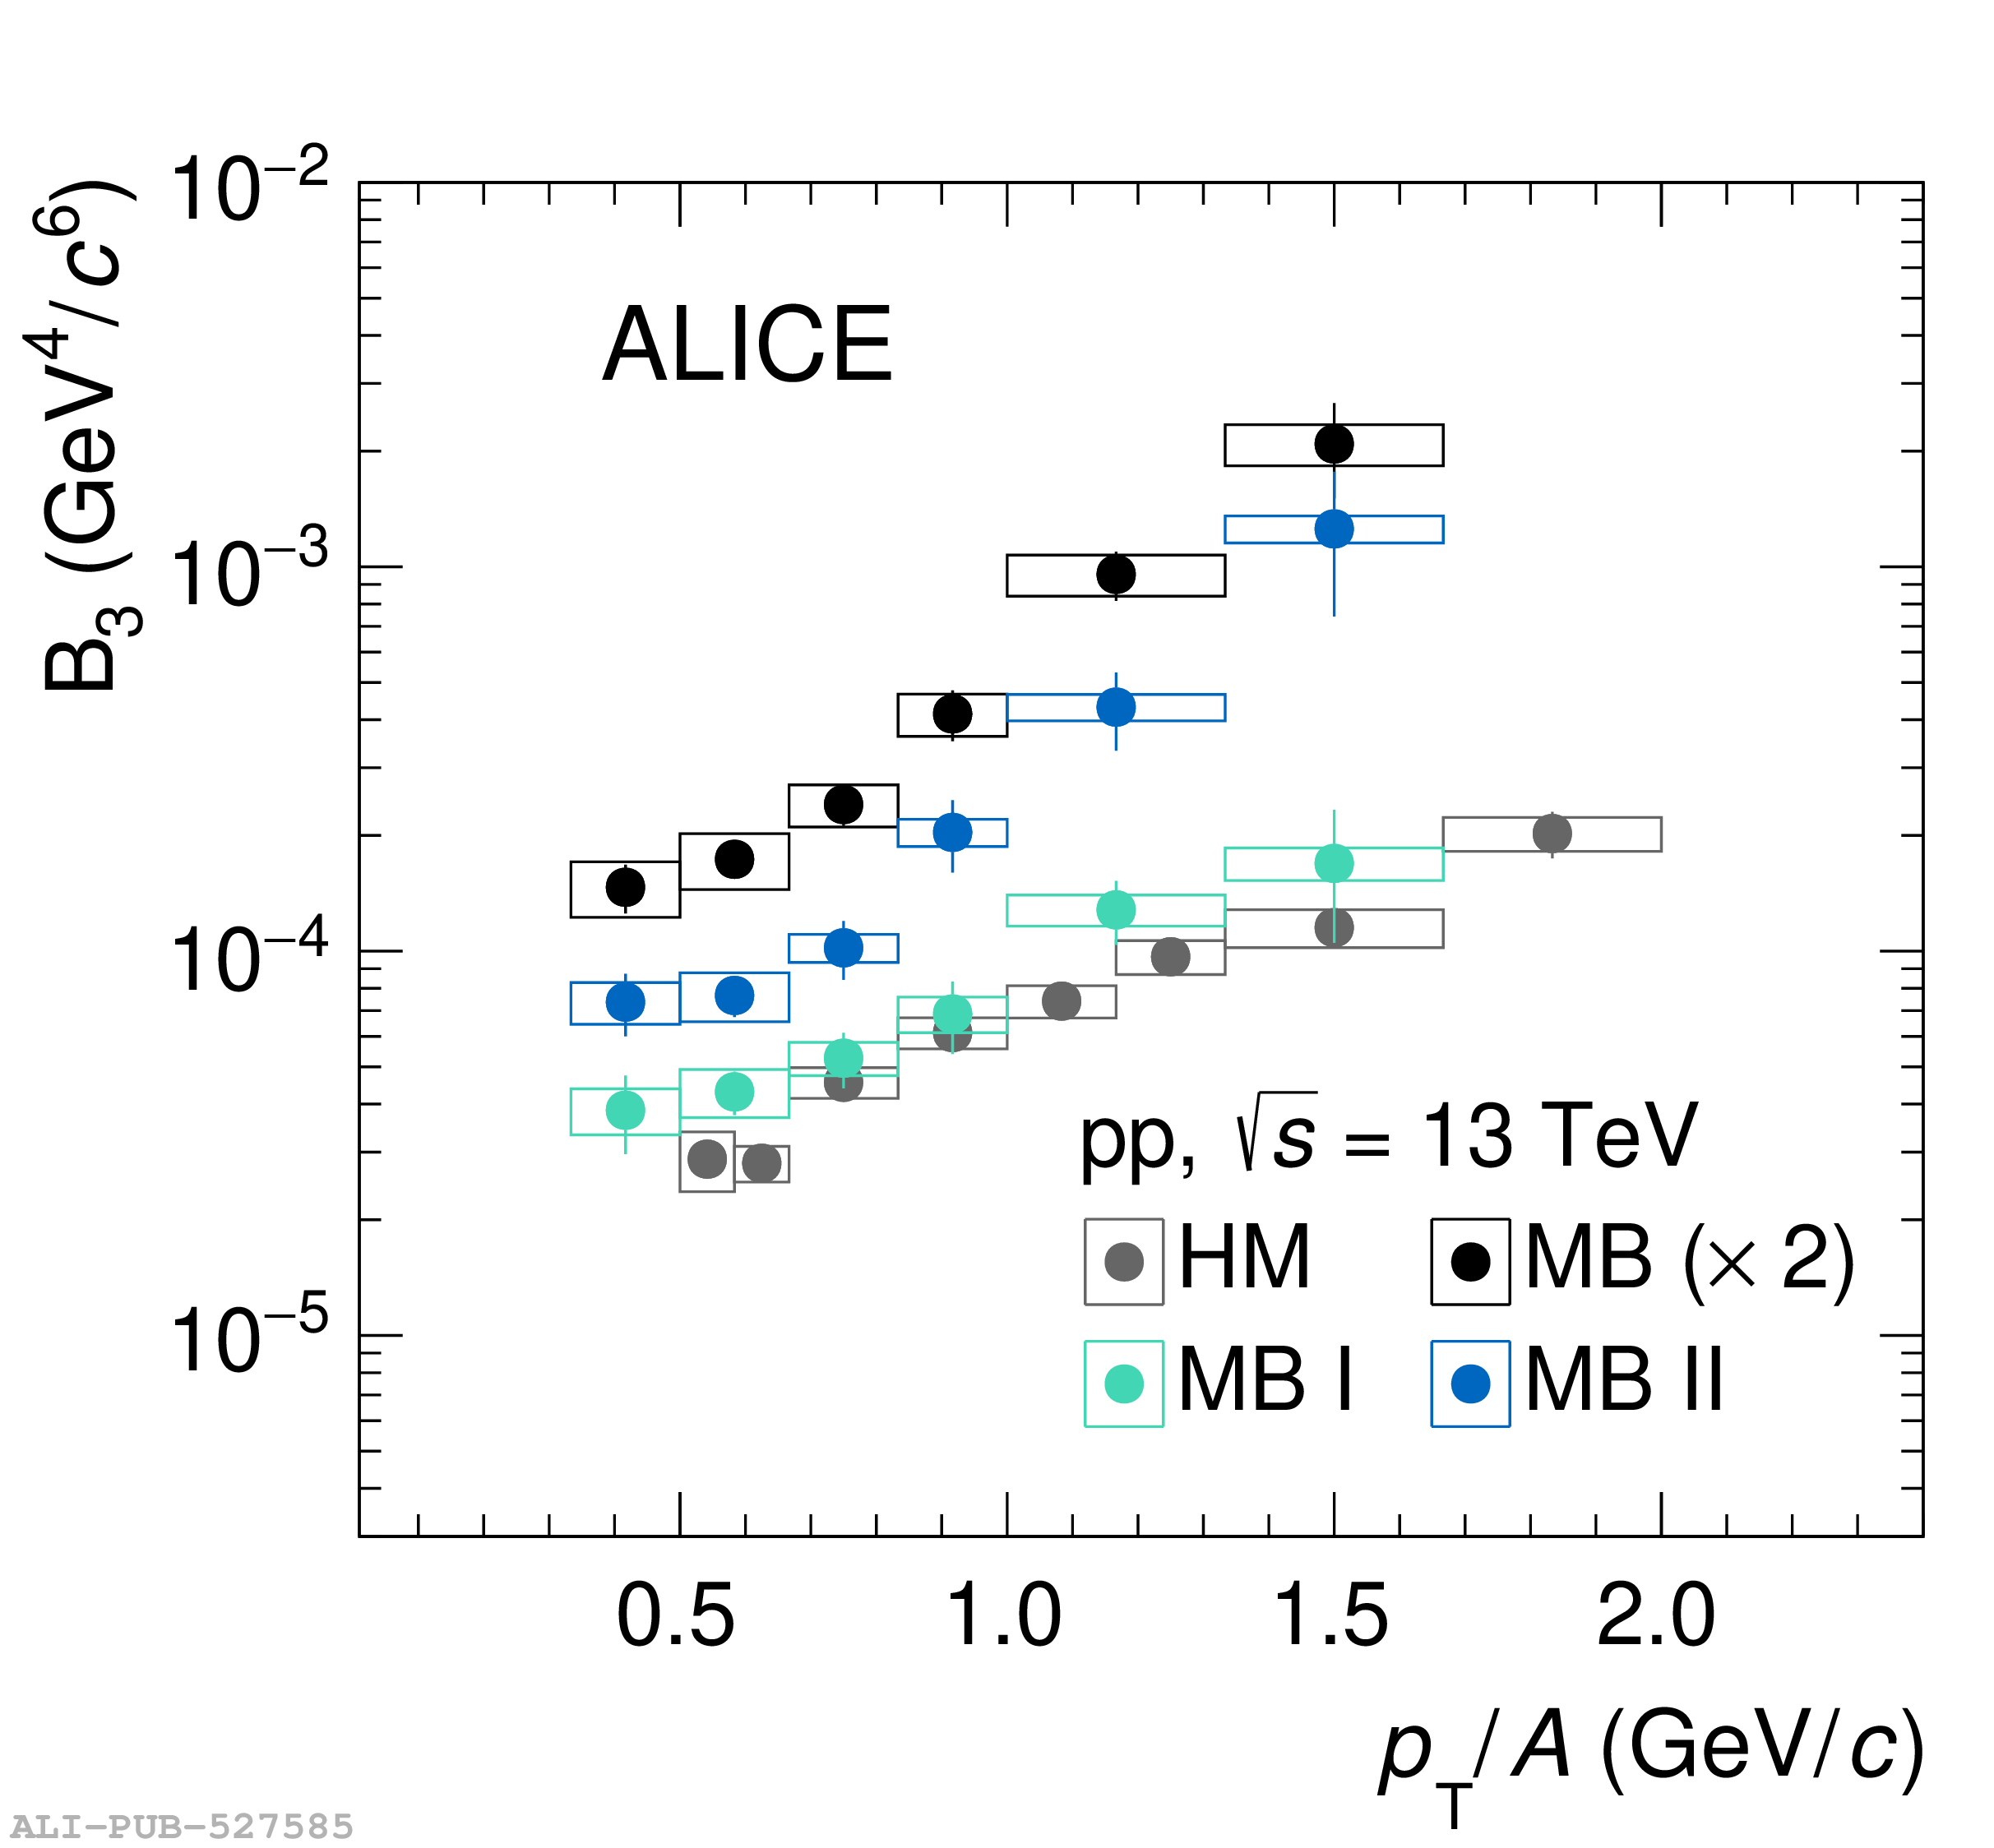 |
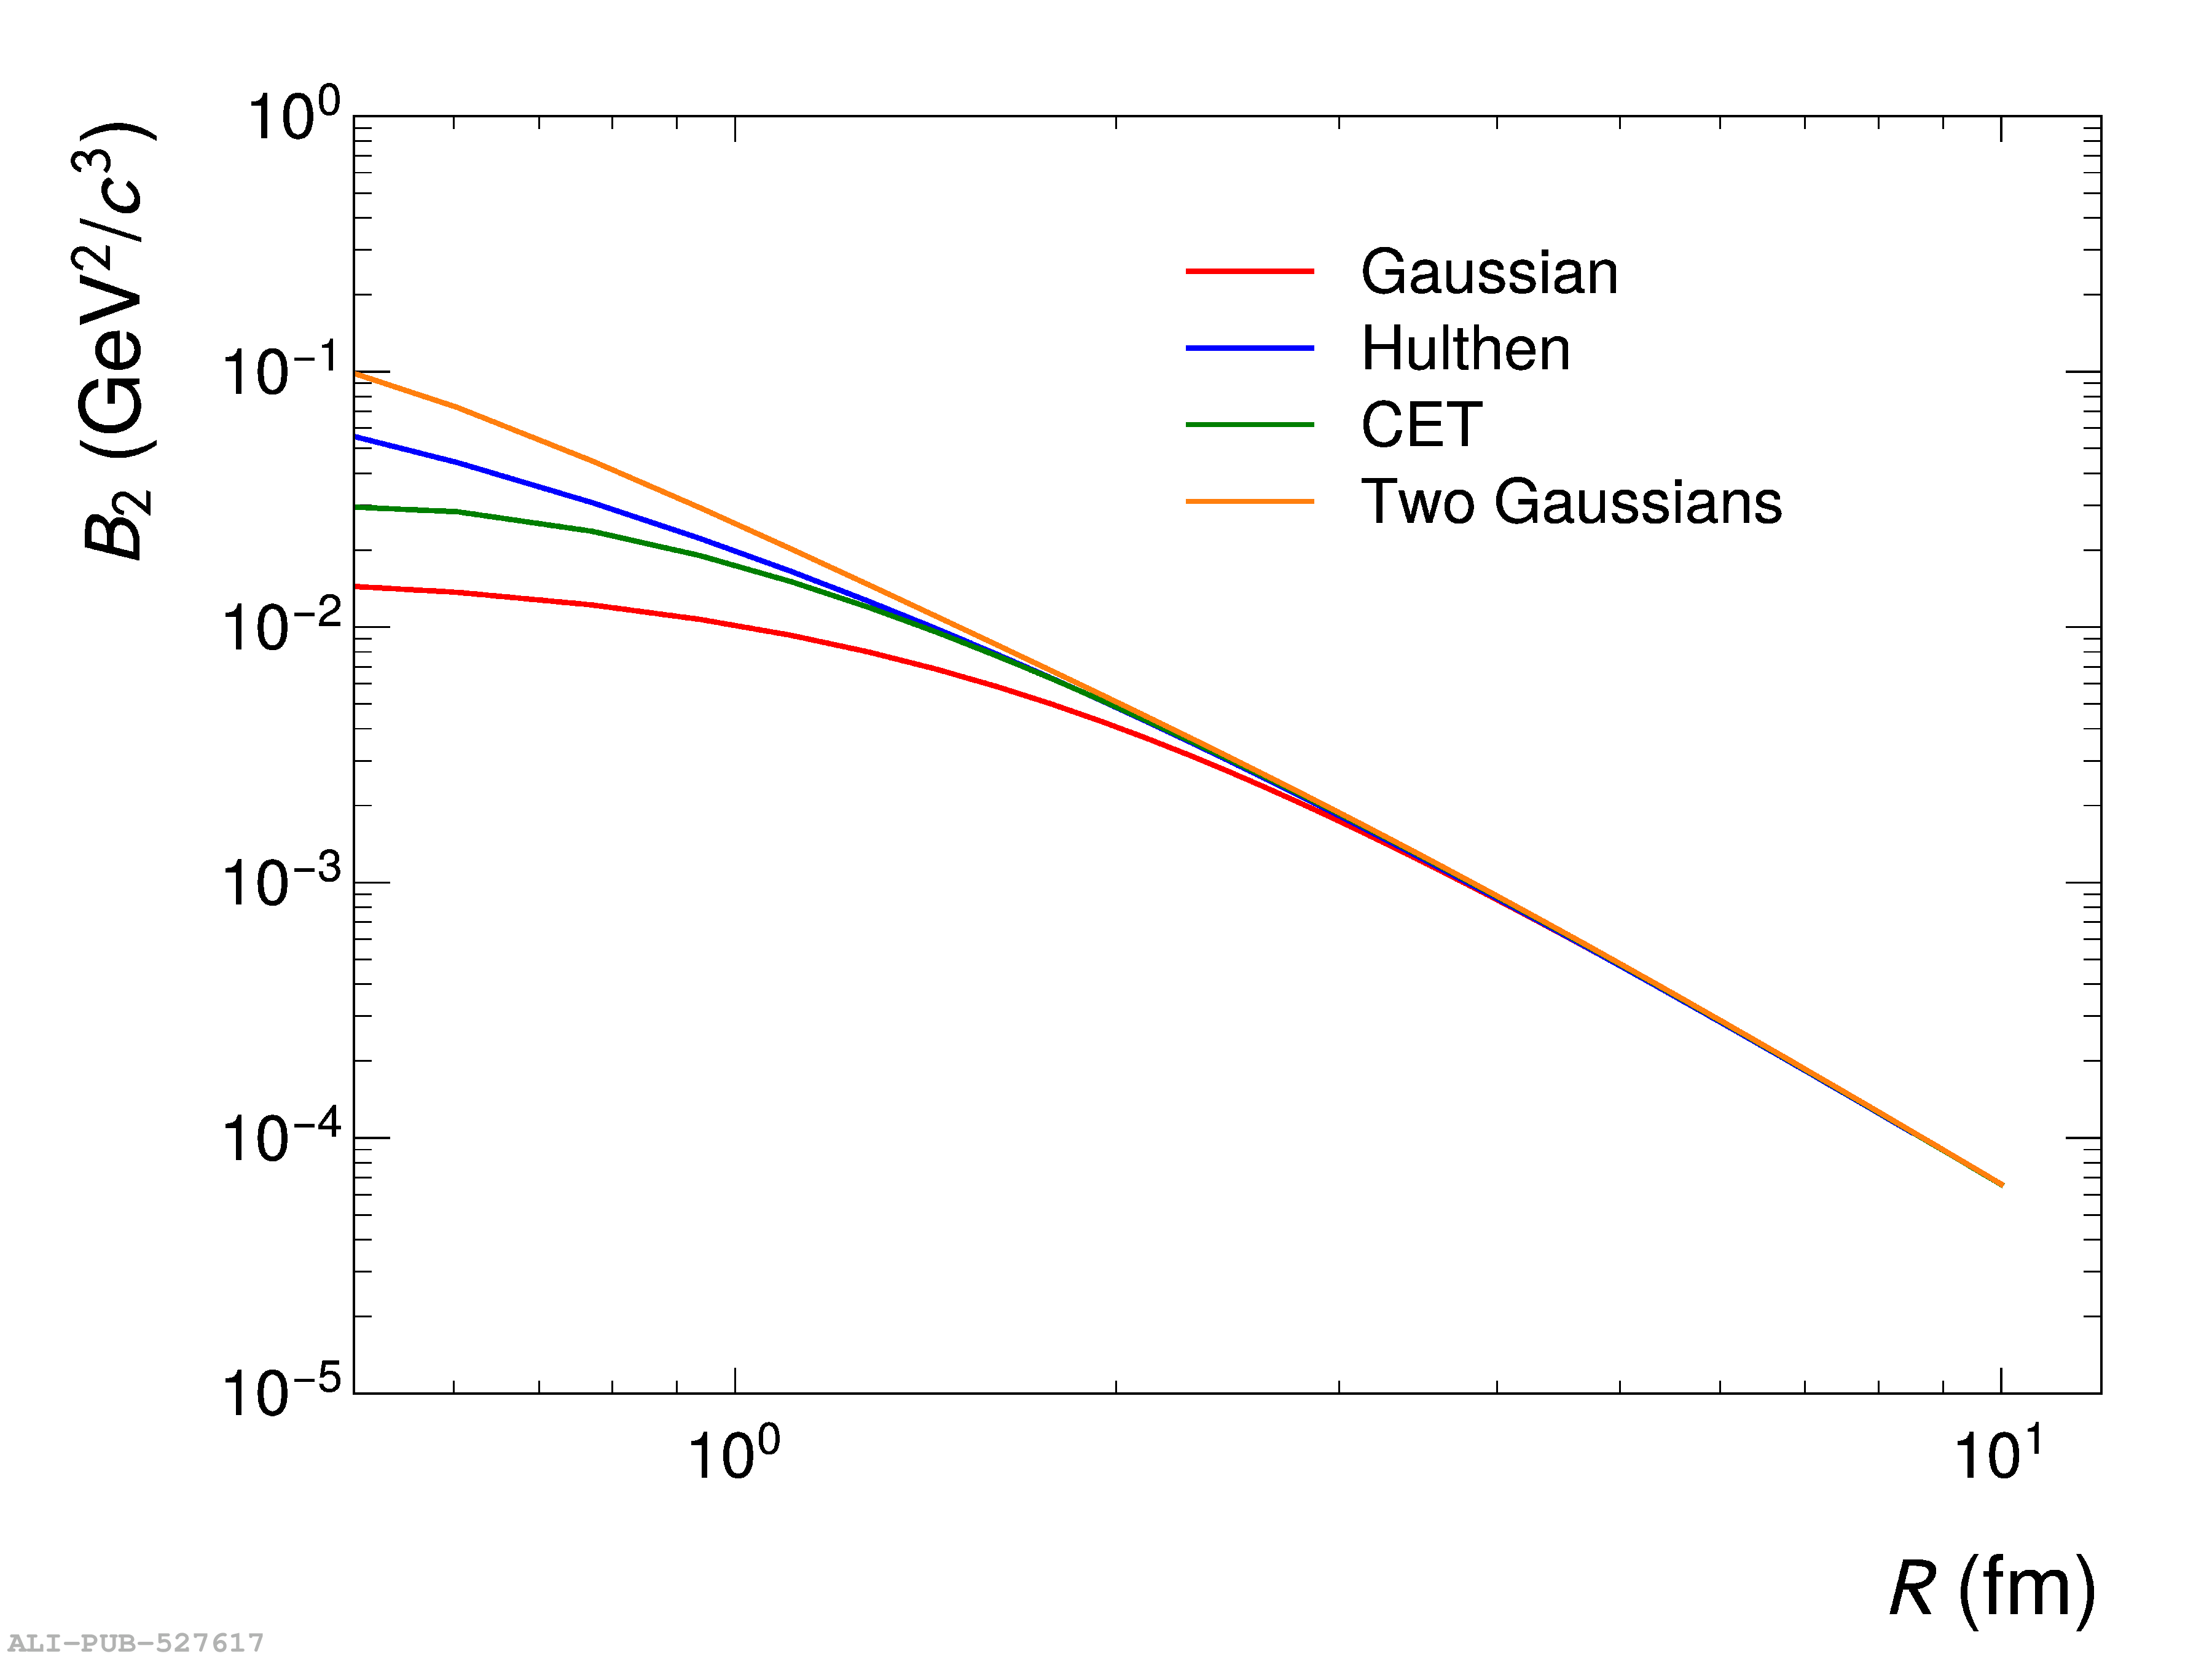
Figure 3
(Anti)deuterons. (Anti)helions. Comparison between measurements and theoretical predictions for the coalescence parameters $B_{2}$ for (anti)deuterons (a) and $B_{3} $ for (anti)helions (b) as a function of $p_{\mathrm{T}}/A$. Vertical bars and boxes represent statistical and systematic uncertainties, respectively. Theoretical predictions are obtained using different wave functions to describe nuclei: Gaussian (yellow), Hulthen (blue), $\chi \text{EFT}$ (gray) and two Gaussians (green). | 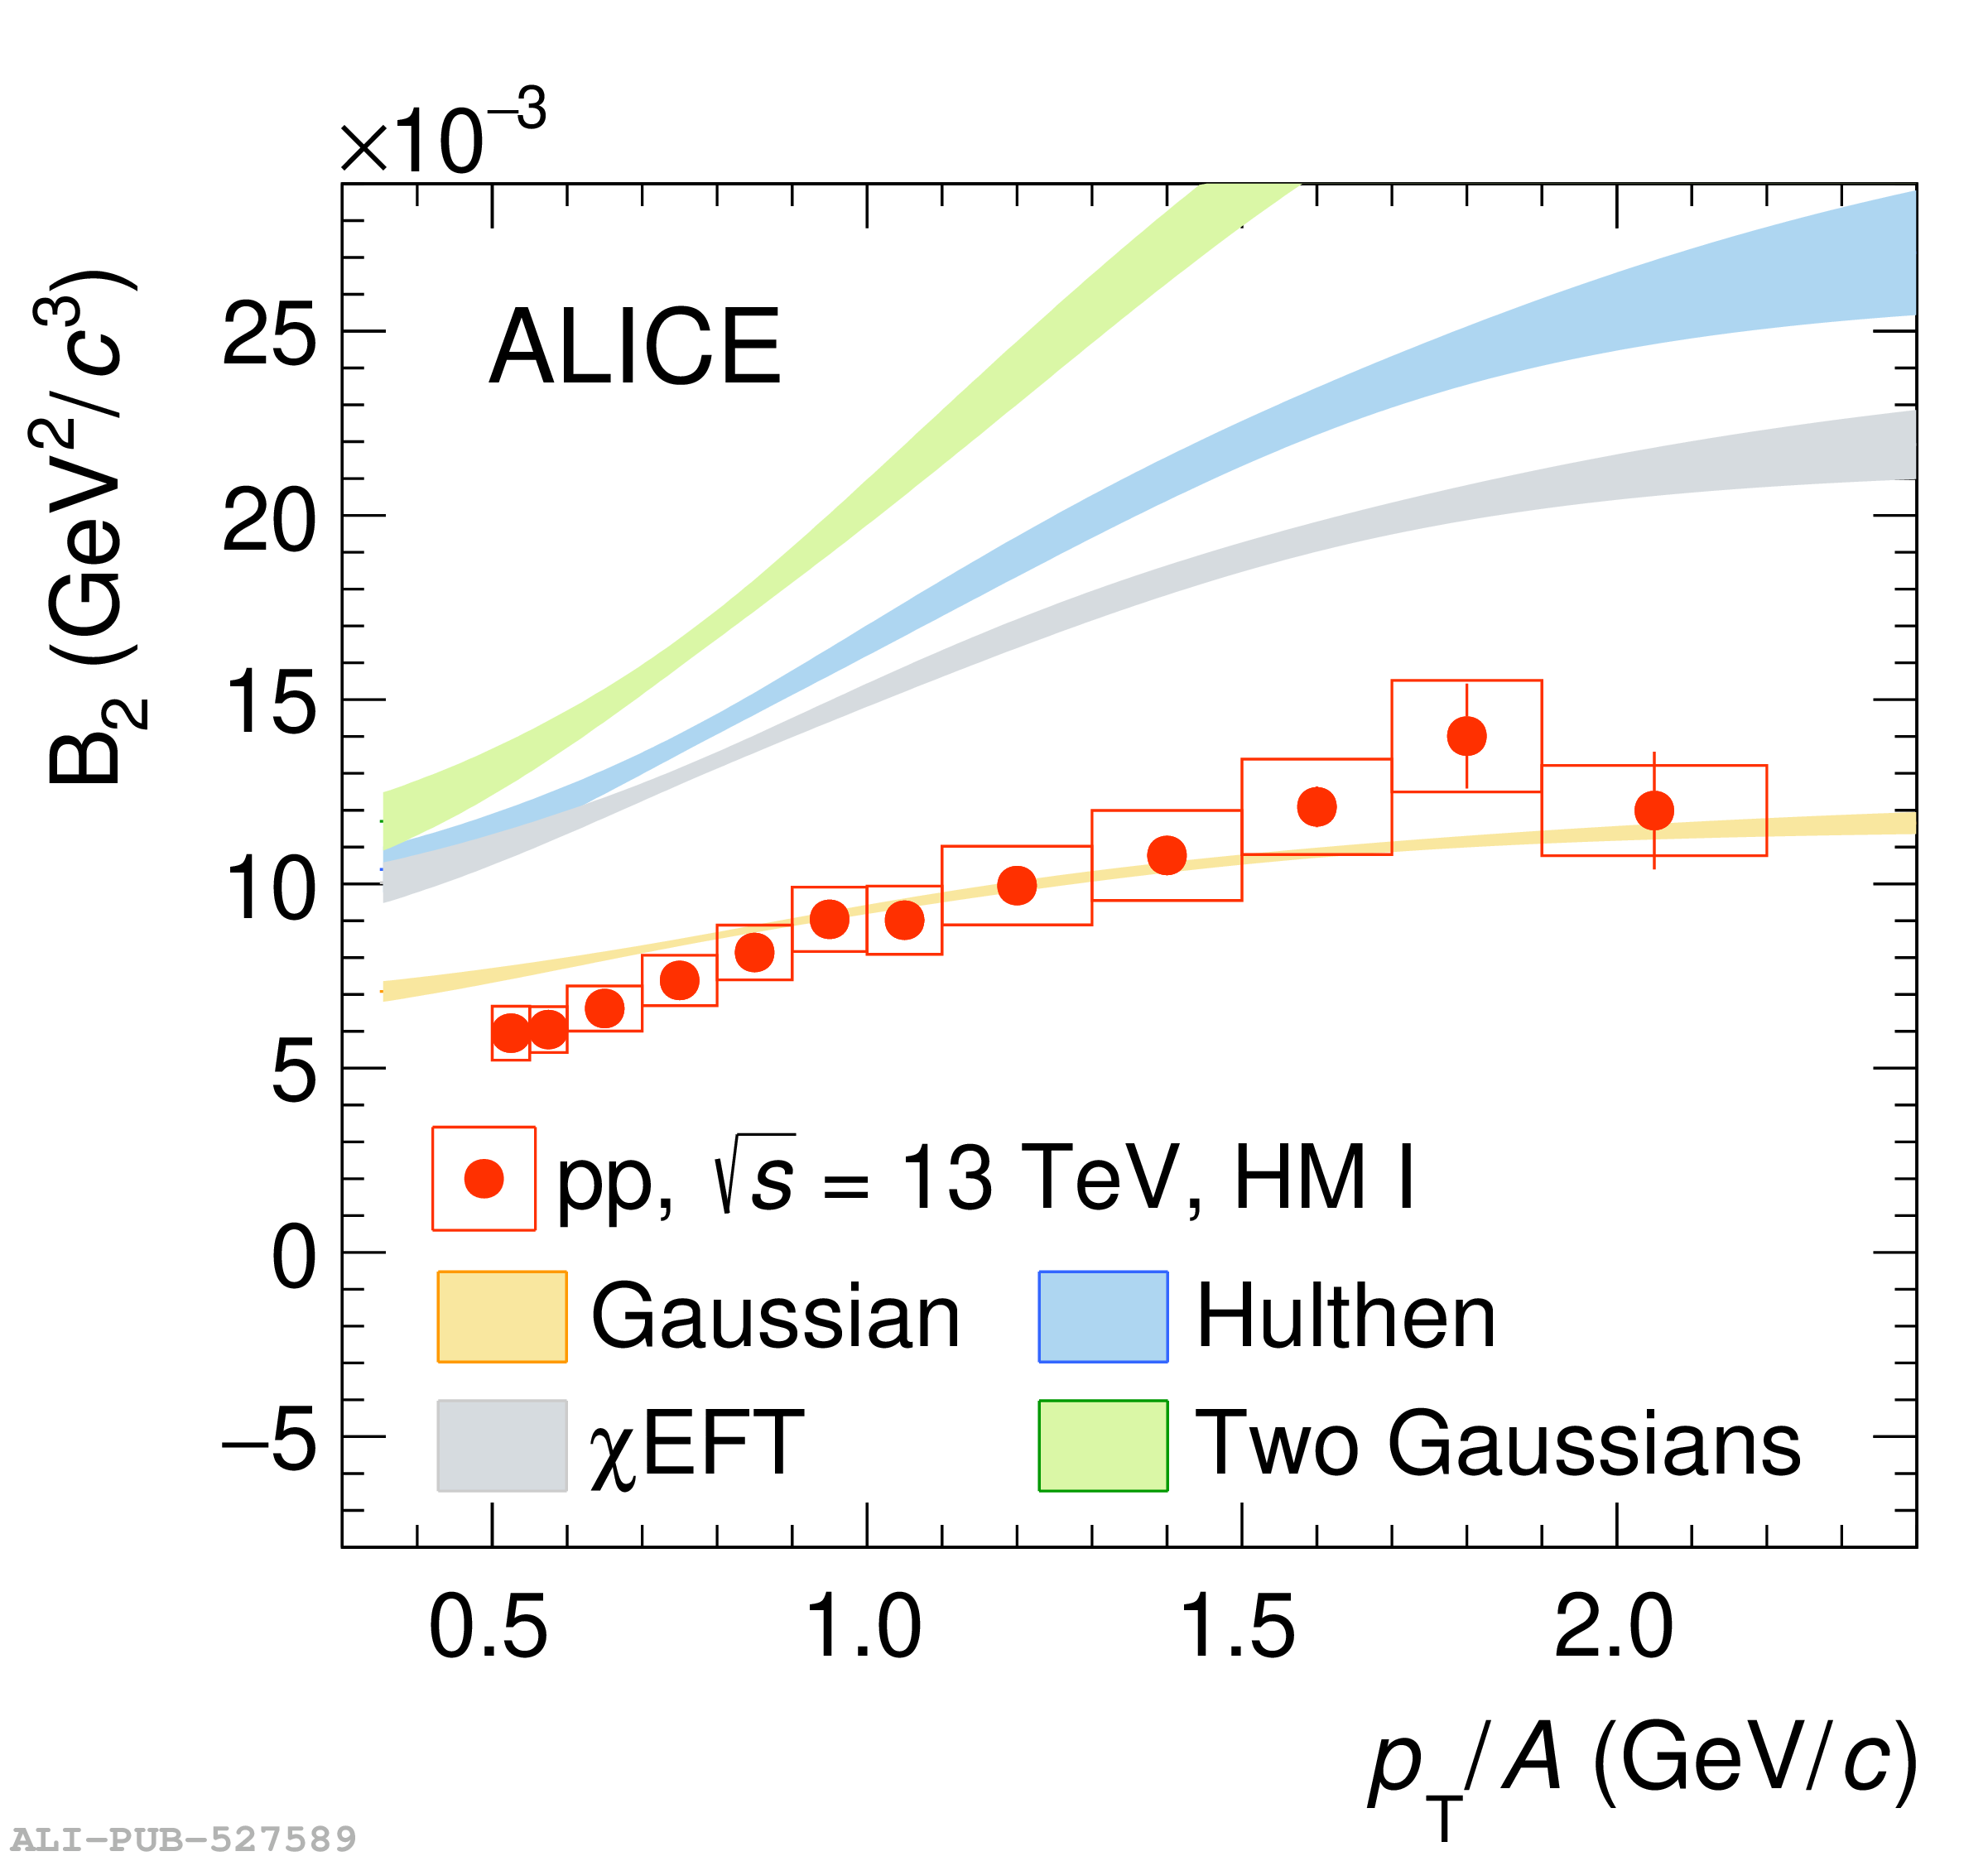 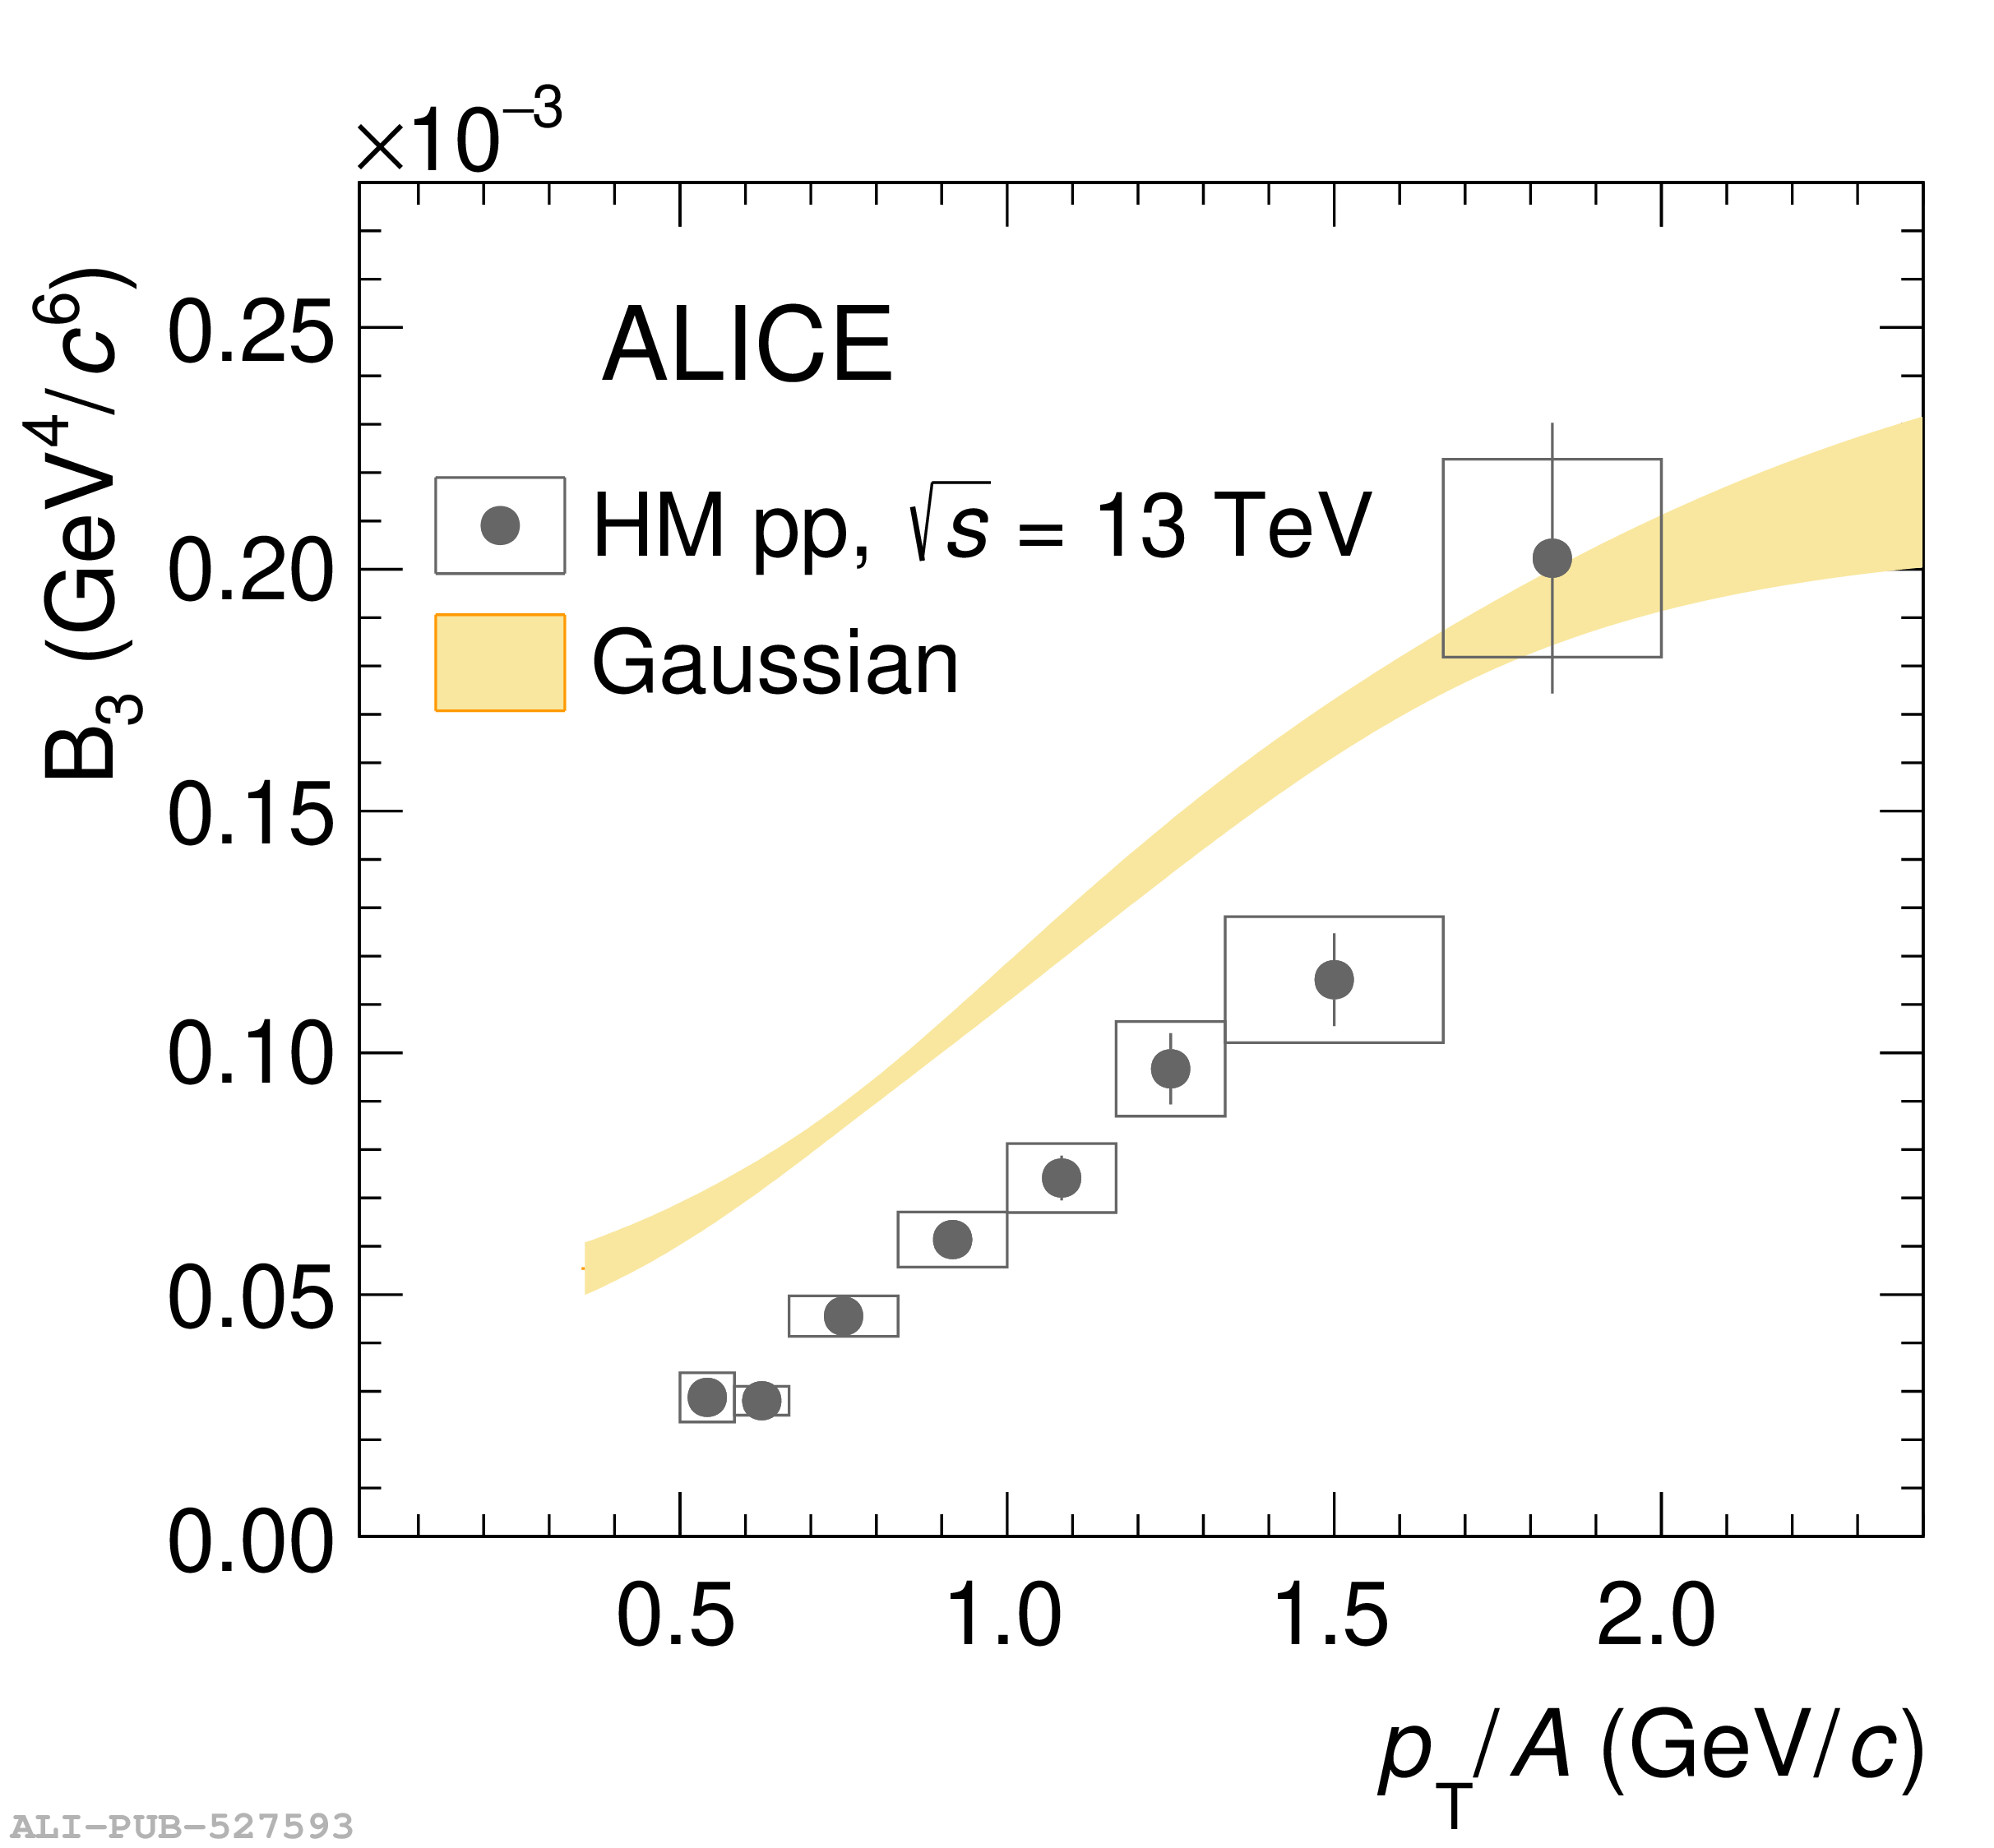 |
Figure 4
Ratio between the \pt spectra of triton and helion for the HM data sample. Vertical bars and boxes represent statistical and systematic uncertainties, respectively. The measurements are compared with the prediction of thermal (red) and coalescence models from Ref. (yellow) and Ref. (green and blue). | 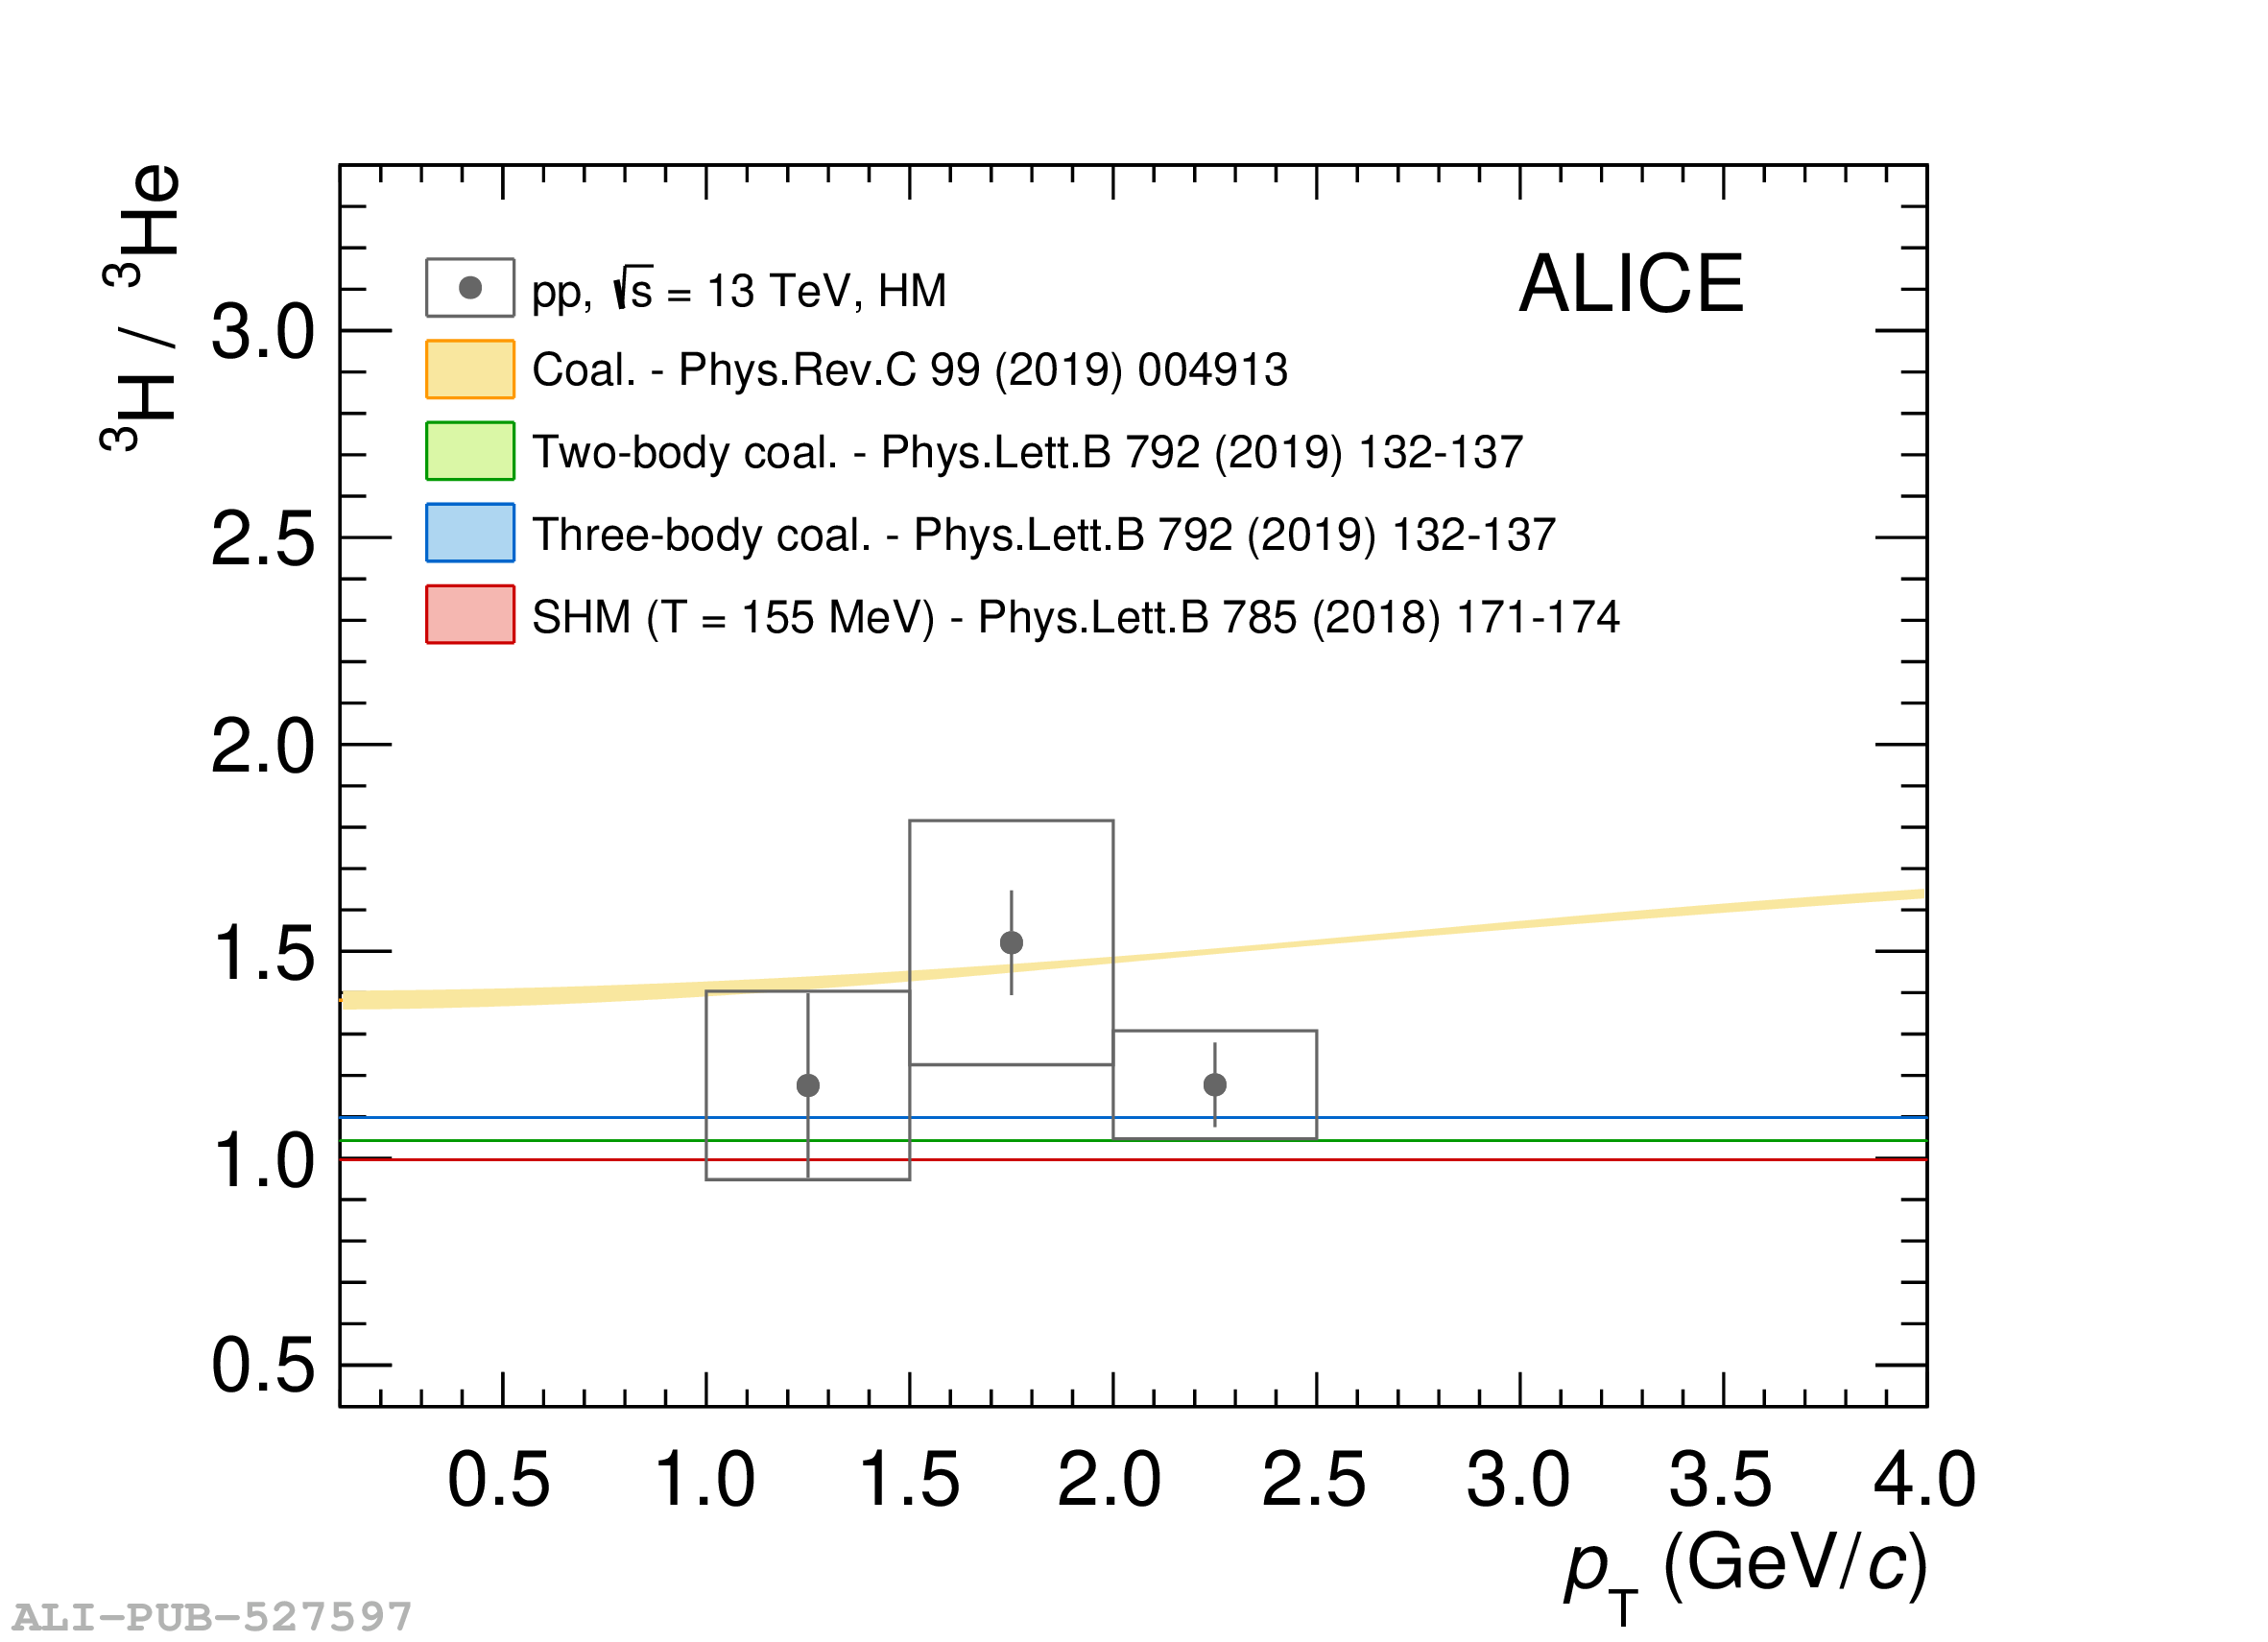 |
Figure 5
(Anti)deuterons. (Anti)helions. (a): $B_2$ at $p_{\mathrm{T}}/A = $ 0.75 GeV/c as a function of multiplicity in HM pp collisions at $\sqrt{s} = 13$ TeV, in MB pp collisions at $\sqrt{s} = 13$ TeV and at $\sqrt{s} = 7$ TeV , in p--Pb collisions at $\snn = 5.02$ TeV , and in Pb--Pb collisions at $\snn = 2.76$ TeV . (b): $B_3$ at $p_{\mathrm{T}}/A = $ 0.73 GeV$/$c as a function of multiplicity in HM pp collisions at $\sqrt{s} = 13$ TeV, in MB pp collisions at $\sqrt{s} = 13$ TeV, in p--Pb collisions at $\snn = 5.02$ TeV , and in Pb--Pb collisions at $\snn = 2.76$ TeV . Vertical bars and boxes represent statistical and systematic uncertainties, respectively. The two lines are theoretical predictions based on two different parameterisations of the source radius. | 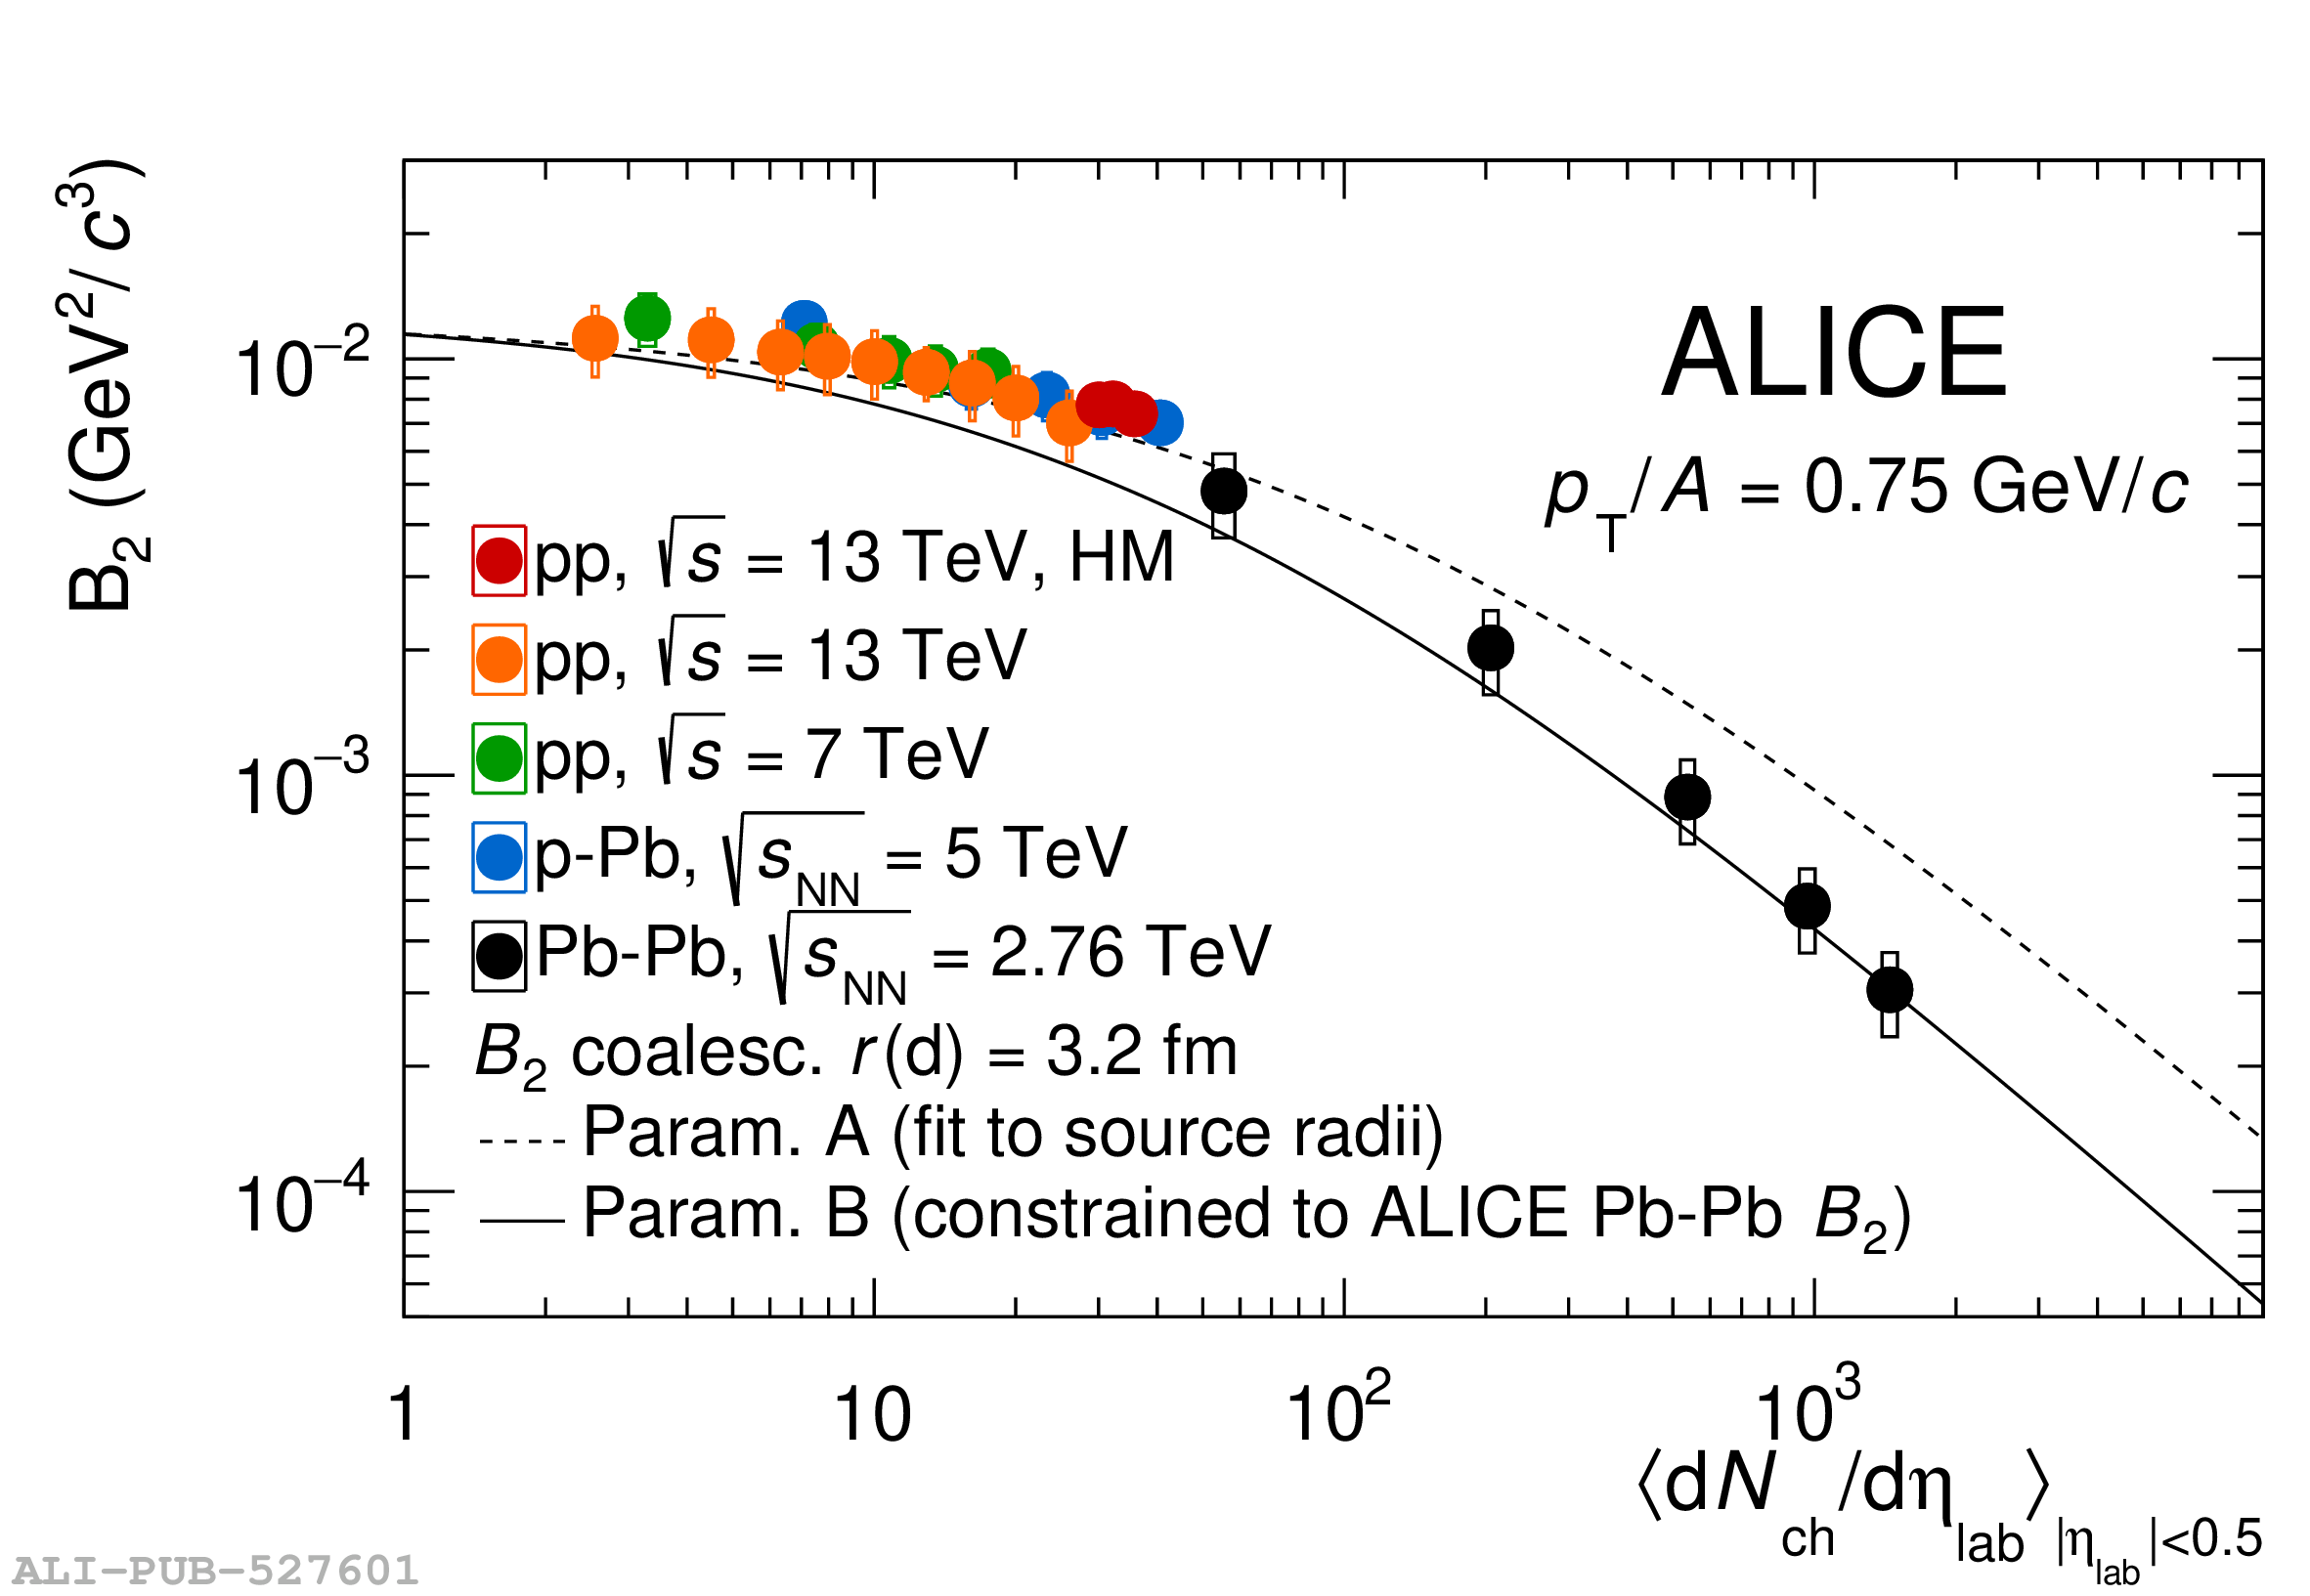  |
Figure 6
(Anti)deuterons. (Anti)helions. Ratio between the \pt-integrated yields of nuclei and protons as a function of multiplicity for (anti)deuterons (a) and (anti)helions (b). Measurements are performed in HM pp collisions at $\sqrt{s} = 13$ TeV, in MB pp collisions at $\sqrt{s} = 13$ TeV and at $\sqrt{s} = 7$ TeV , in p--Pb collisions at $\snn = 5.02$ TeV , and in Pb--Pb collisions at $\snn = 2.76$ TeV . Vertical bars and boxes represent statistical and systematic uncertainties, respectively. The two black lines are the theoretical predictions of the Thermal-FIST CSM for two sizes of the correlation volume $V_{\mathrm{C}}$. For (anti)deuterons, the green line represents the expectation from a coalescence model . For (anti)helion, the blue and green lines represent the expectations from a two-body and three-body coalescence model, respectively . | 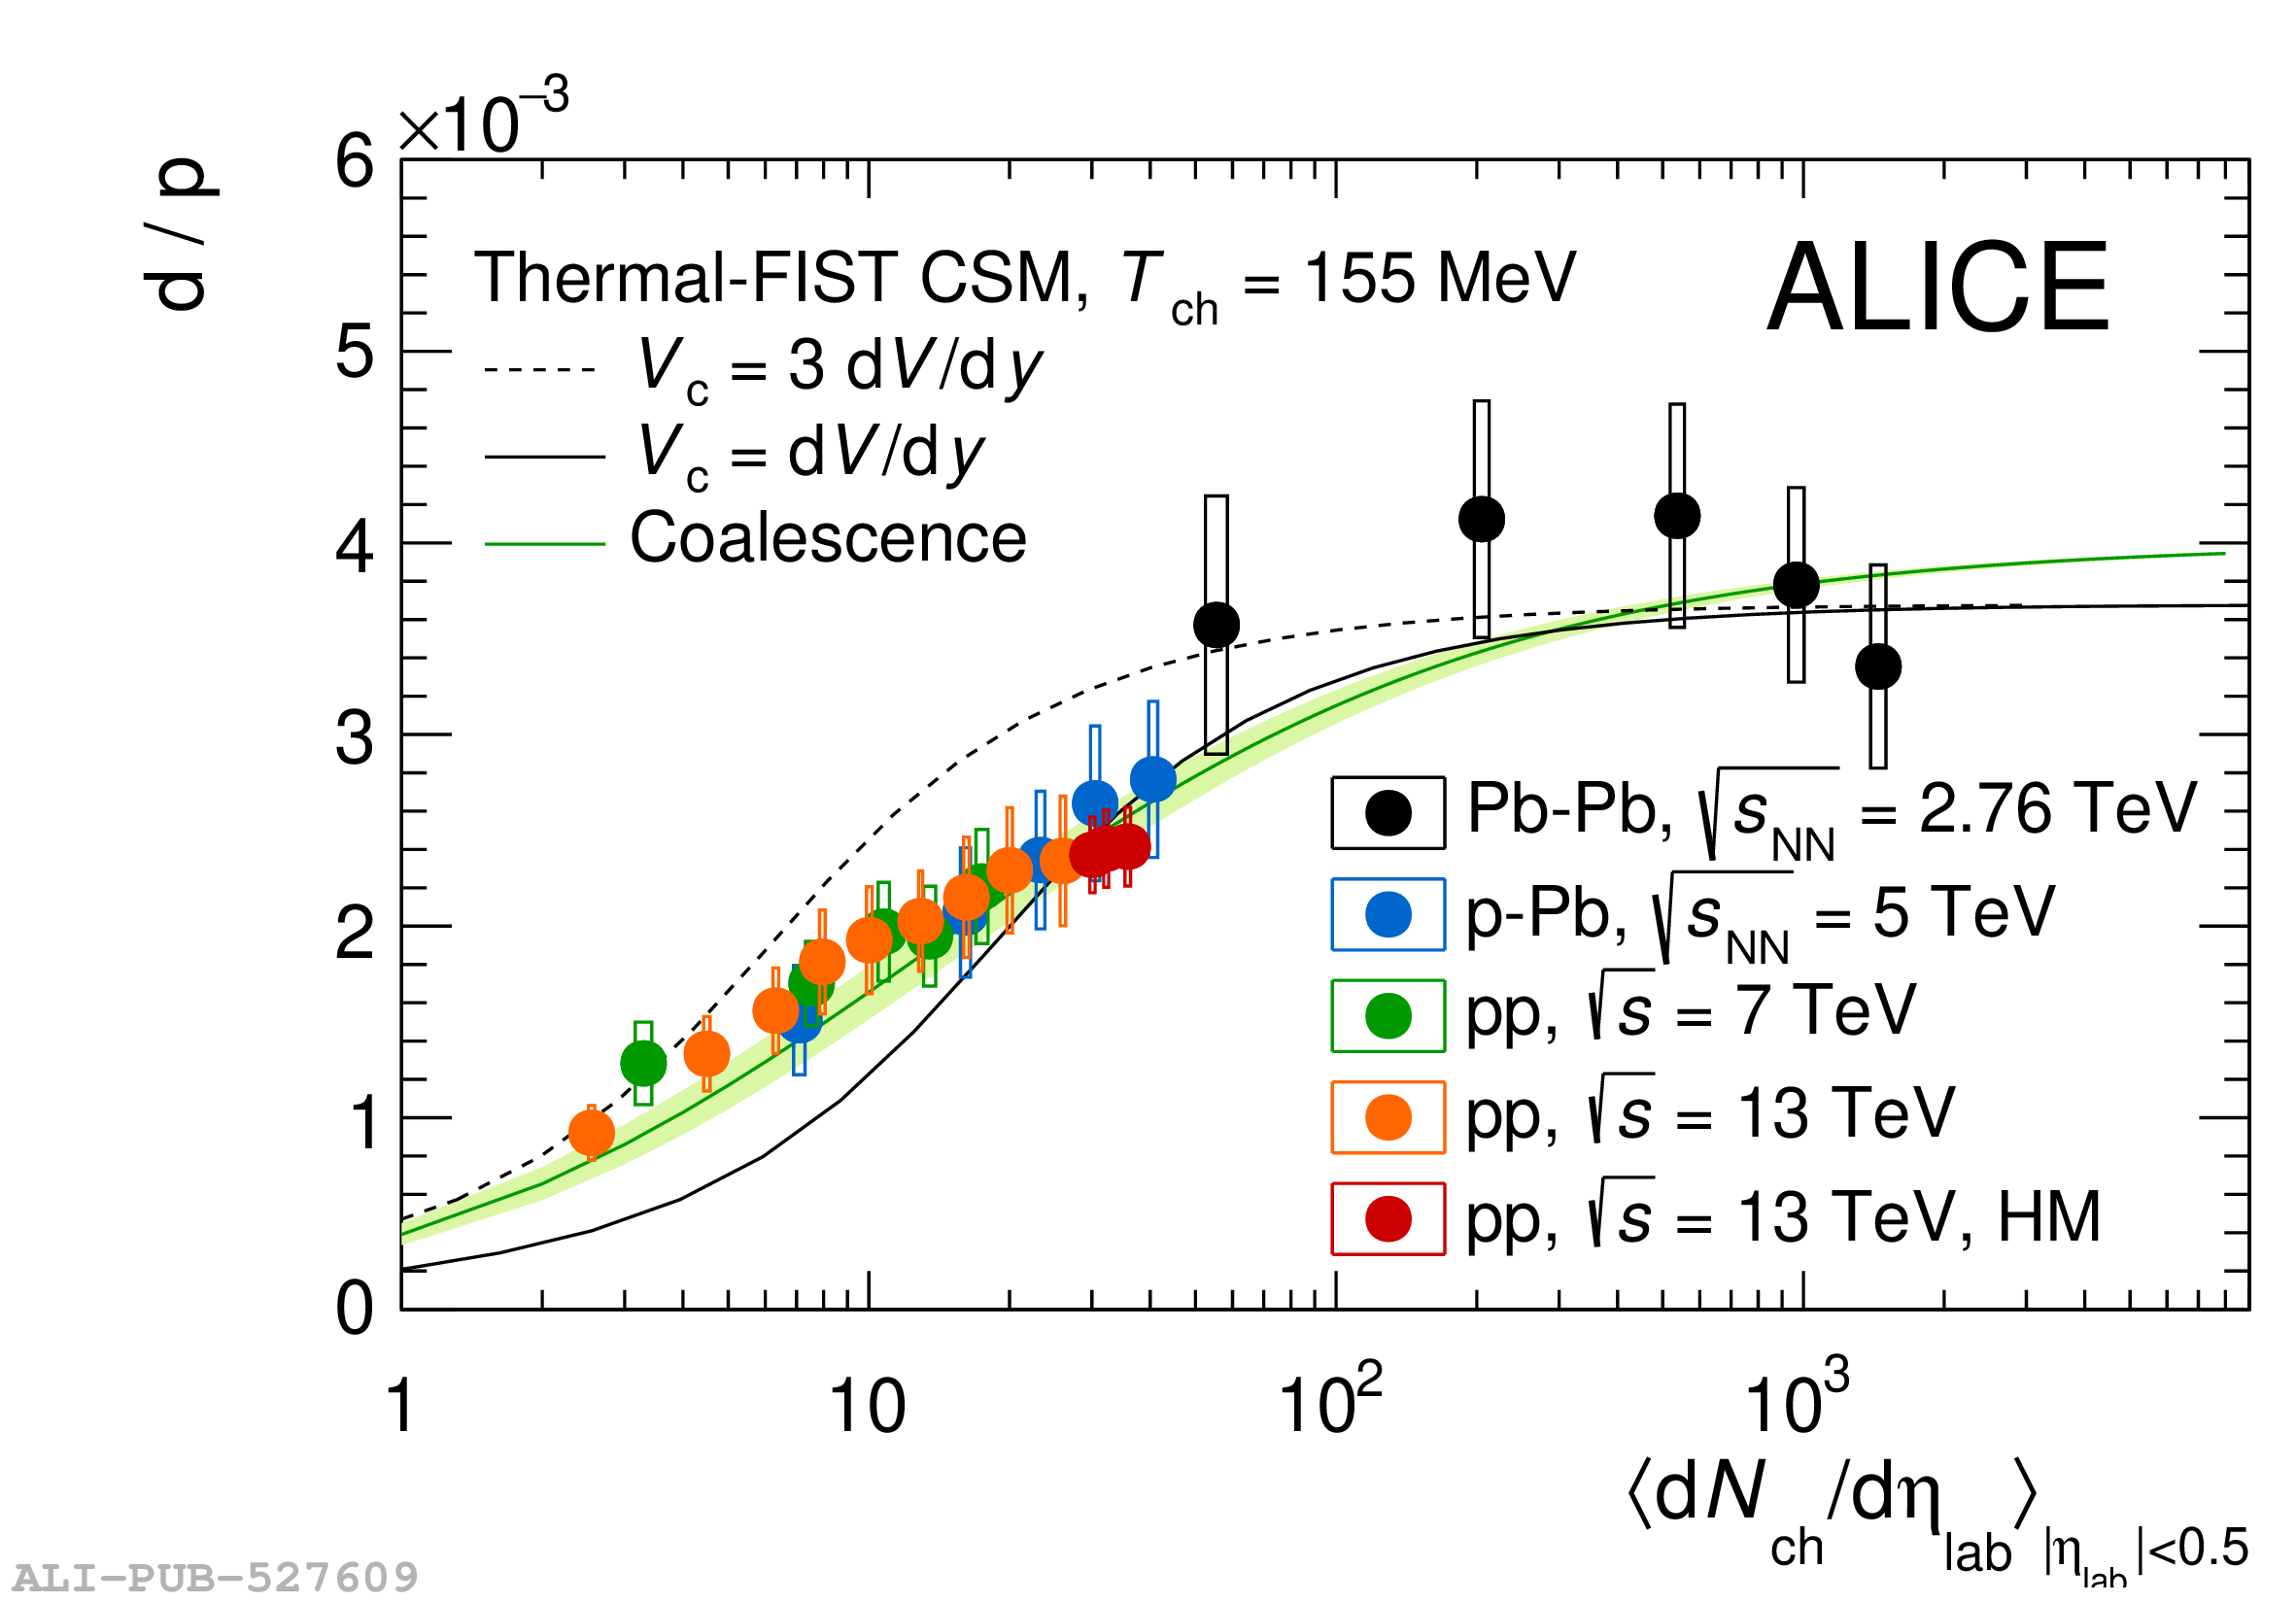 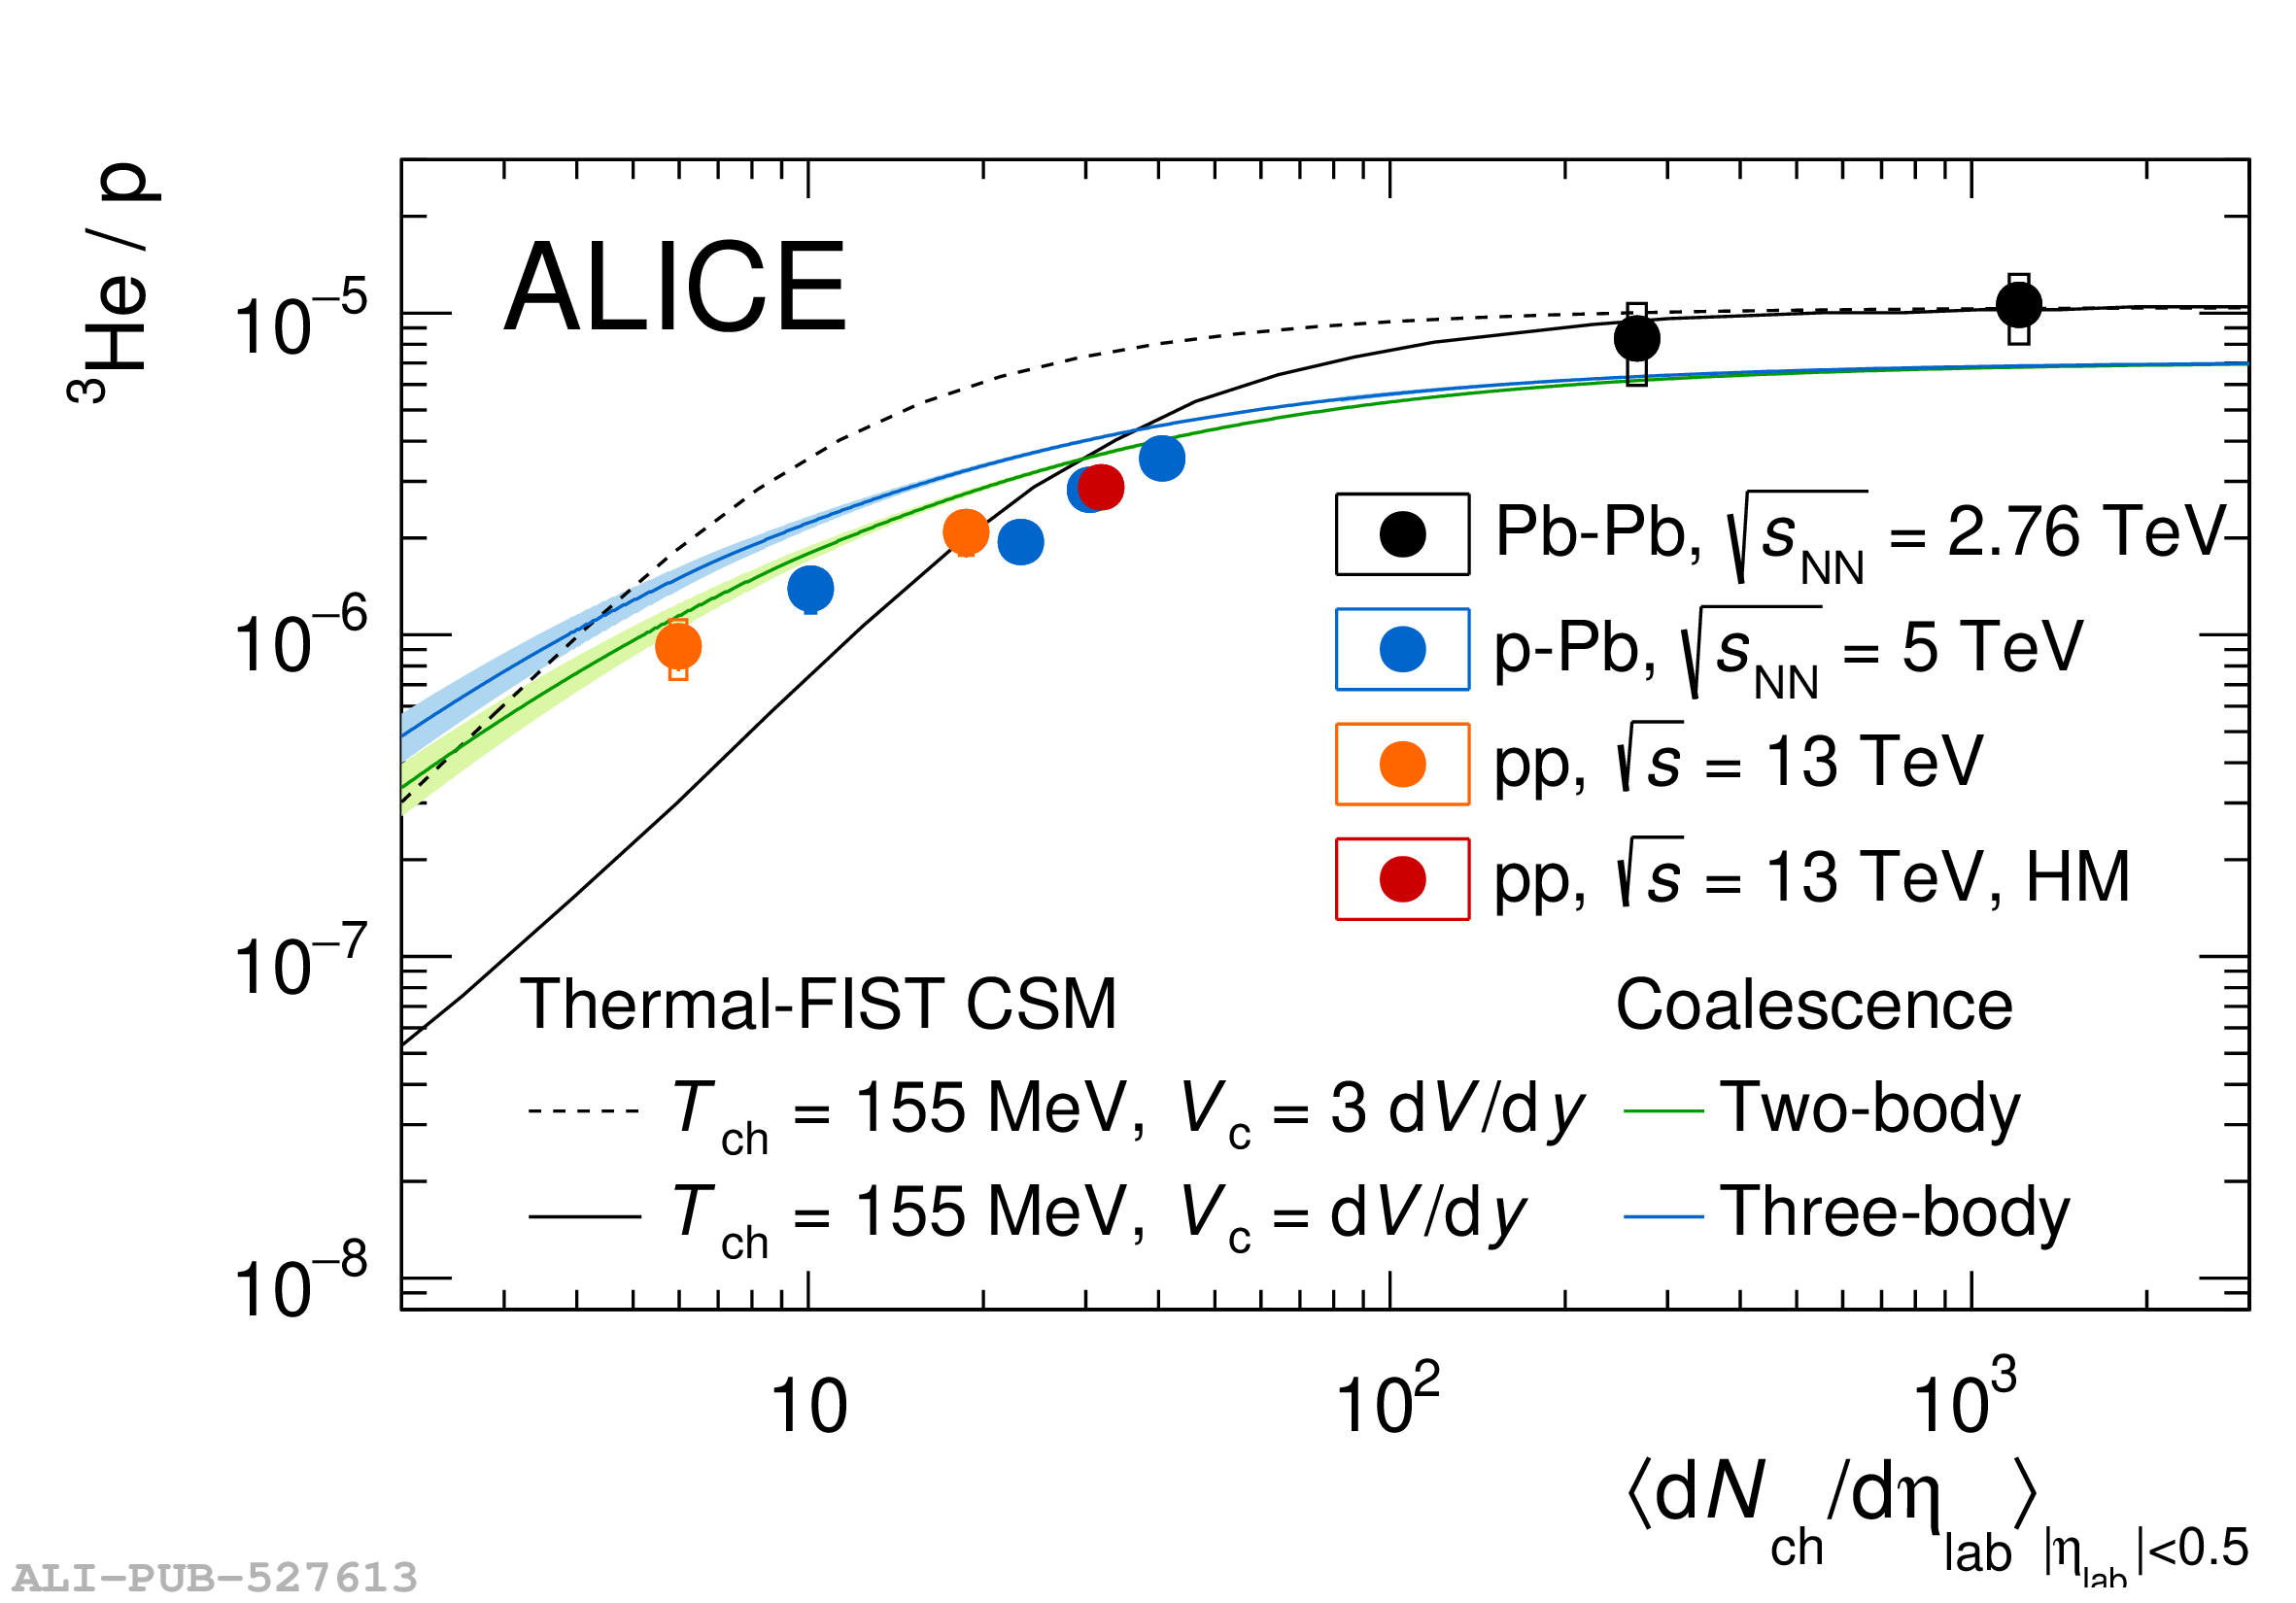 |