The measured d$E$/d$x$ in the TPC expressed as a standard deviation from the expected energy loss of electrons, normalised by the energy-loss resolution ($\sigma_{\rm TPC}$) for $2 < \pt < 2.5$ \GeVc. The various curves are the different fit function results for the different peaks of the distribution. A Gaussian distribution, centered around zero, describes the electron candidates, and the pions and protons are the curves around $n_{\sigma}^{\rm TPC} < -4$ (Landau distribution multiplied by an Exponential distribution) and $n_{\sigma}^{\rm TPC} < -8$ (Gaussian distribution), respectively. | 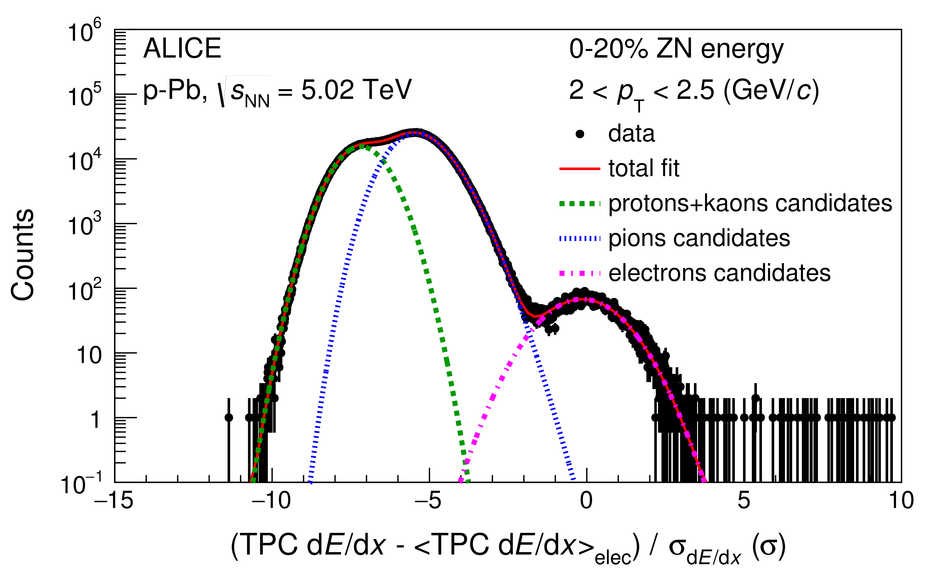 |