Elliptic flow of (anti-)$^{3}$He measured in the centrality classes 0--20$\%$ and 20--40$\%$ in comparison with the predictions from a coalescence model based on phase-space distributions of protons and neutrons generated from the iEBE-VISHNU hybrid model with AMPT initial conditions . The model predictions are shown as lines and the bands represent their statistical uncertainties. The differences between data and model are shown in the lower panel for both centrality classes. The statistical uncertainties of the data and the model are added in quadrature. Vertical bars and boxes represent the statistical and systematic uncertainties, respectively. | 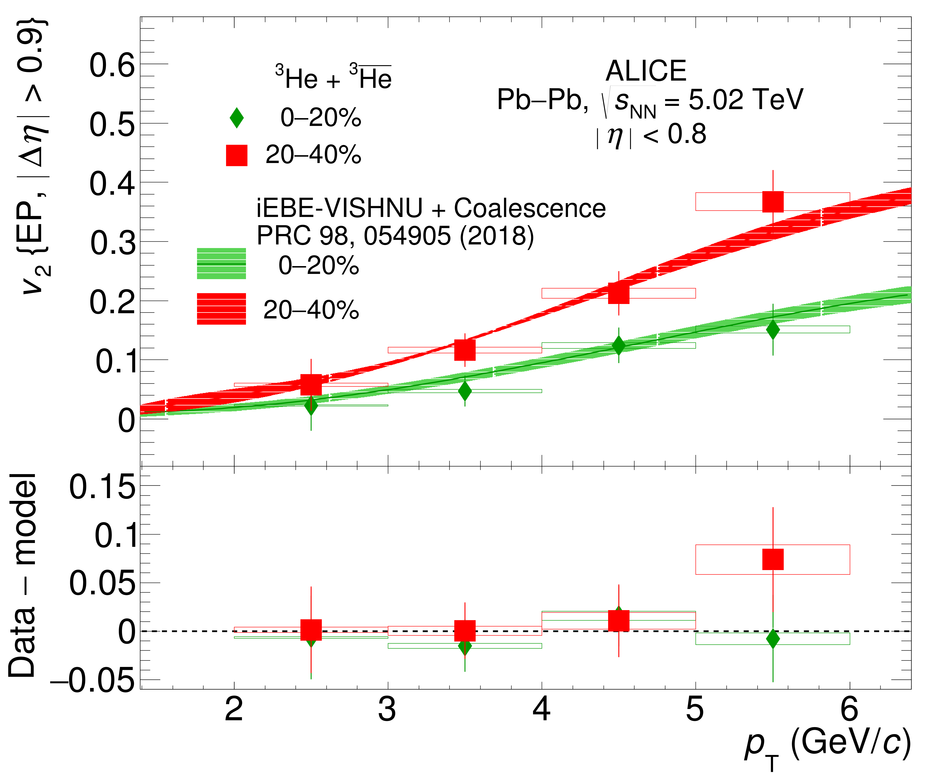 |