Number density $\Nch$ (left) and $\sum \pt$ (right) distributions as a function of \ptlead\, compared to MC predictions in Toward (top), Transverse (middle), and Away (bottom) regions for $\ptmin > 0.5\; \gmom $. The shaded areas in the upper panels represent the systematic uncertainties and vertical error bars indicate statistical uncertainties. In the lower panels, the shaded areas are the sum in quadrature of statistical and systematic uncertainties from the upper panels . No uncertainties are given for the MC calculations. | 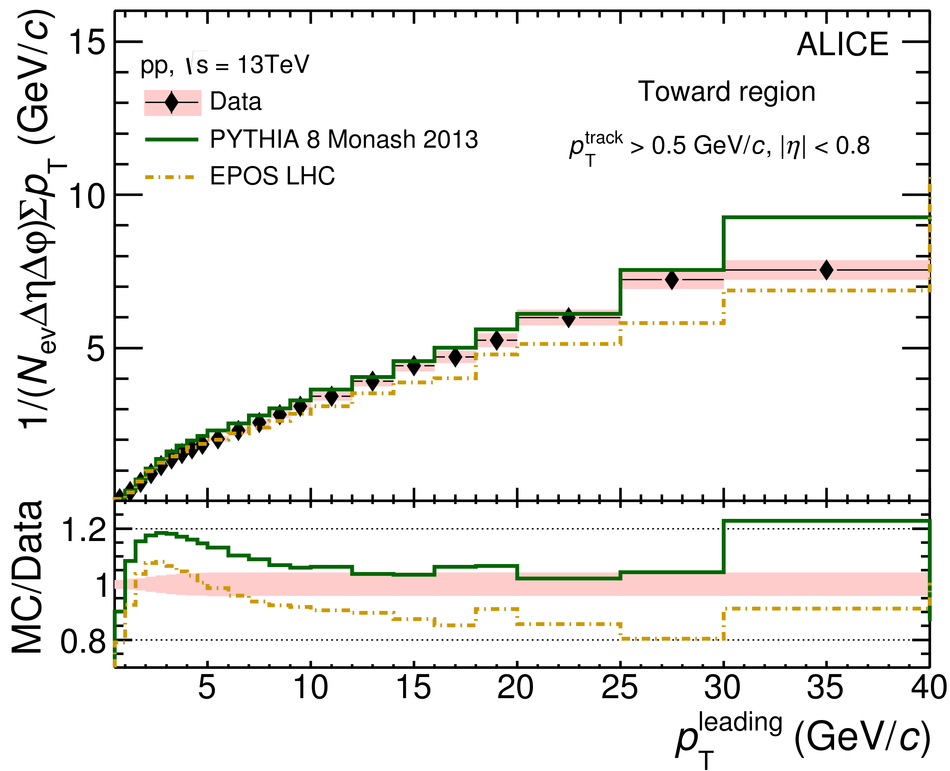 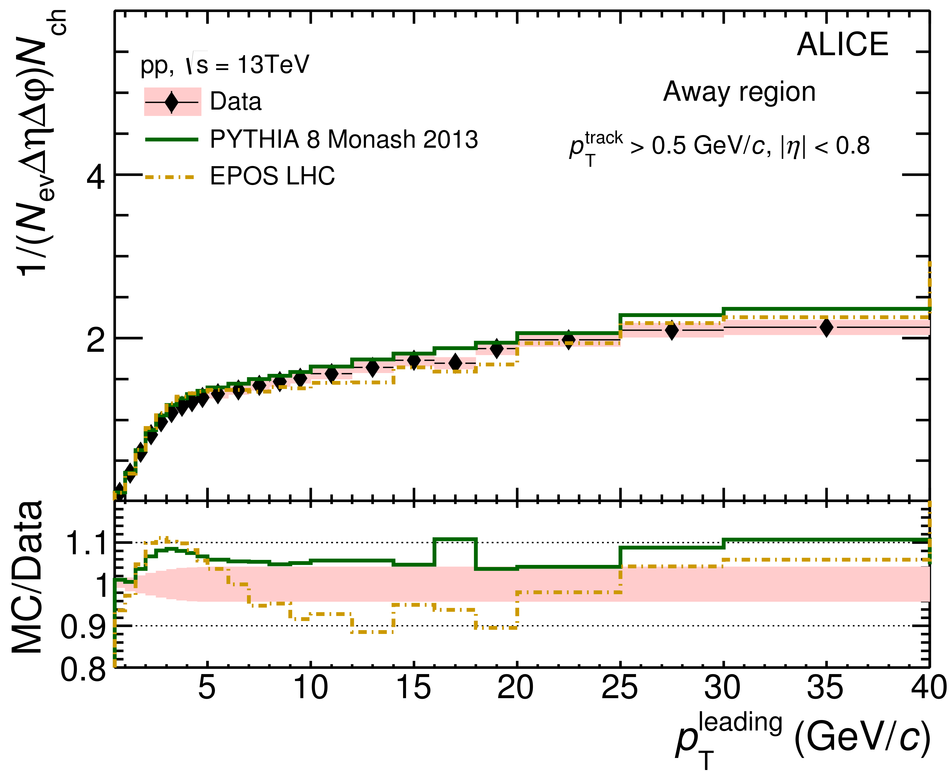  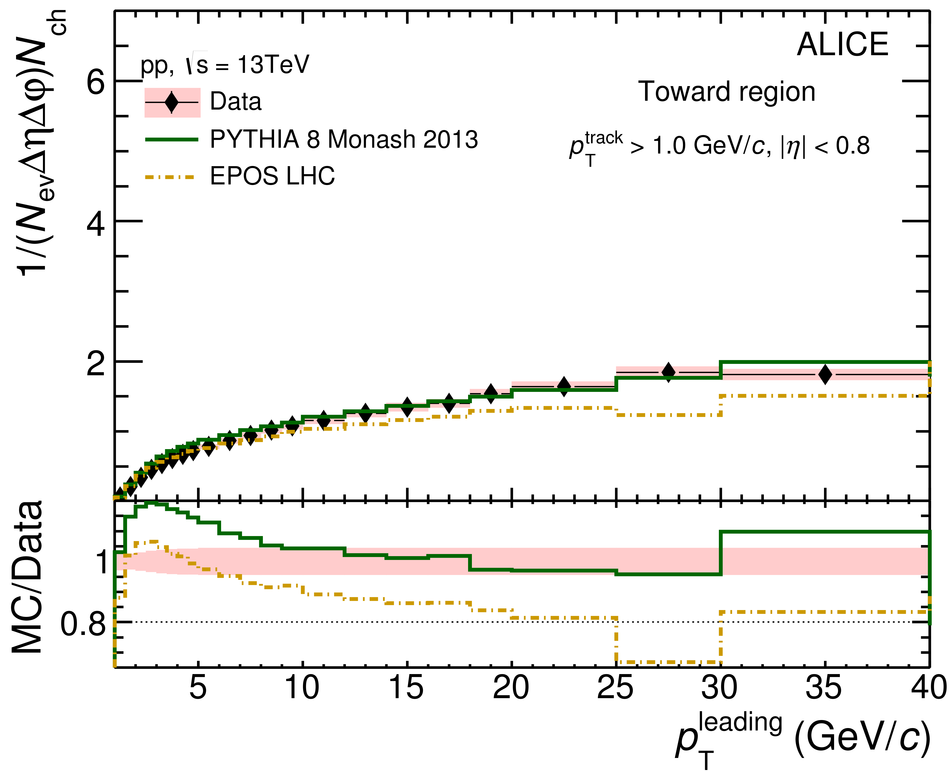 |
![[png]](https://alice-publications.web.cern.ch/sites/default/files/papers/5649/UE13TeV_Transverse_pT_05-101146.png)
![[png]](https://alice-publications.web.cern.ch/sites/default/files/papers/5649/UE13TeV_Transverse_SumpT_05-101151.png)