Number density Nch (left) and ∑ pT density (right) in the Transverse region for pTtrack > 0.5 GeV/c at √s = 13 TeV from ALICE (|η| < 0.8) and ATLAS (|η| < 2.5) measurements [13]. The results are compared to PYTHIA 8 Monash-2013 calculations. The shaded areas represent the systematic uncertainties and vertical error bars indicate statistical uncertainties for the data. No uncertainties are shown for the MC simulations. | 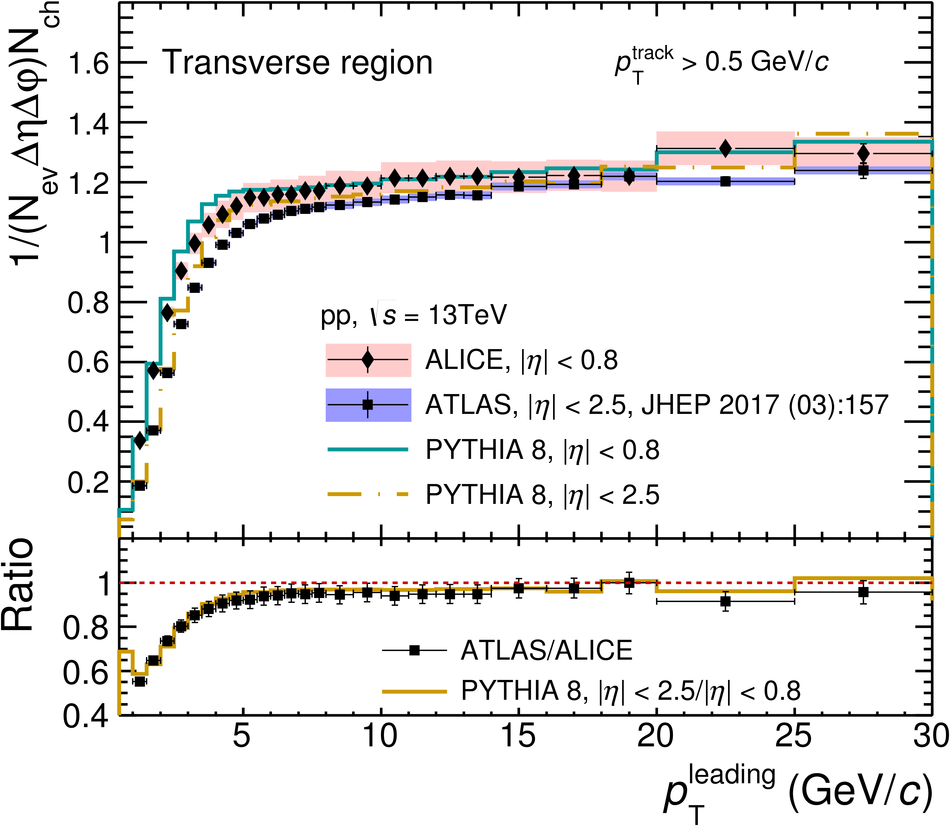 |