Figure 7: Comparison of number density in the plateau of the Transverse region with lower energy data taken from [5, 11] and dNch/dη in minimum-bias events (scaled by 1/2π) [53]. Both are for charged-particles with pT > 0.5 GeV/c. Error bars represent statistical and systematic uncertainties summed in quadrature. The straight lines show the results of fitting data points with the functional form a +blns. |  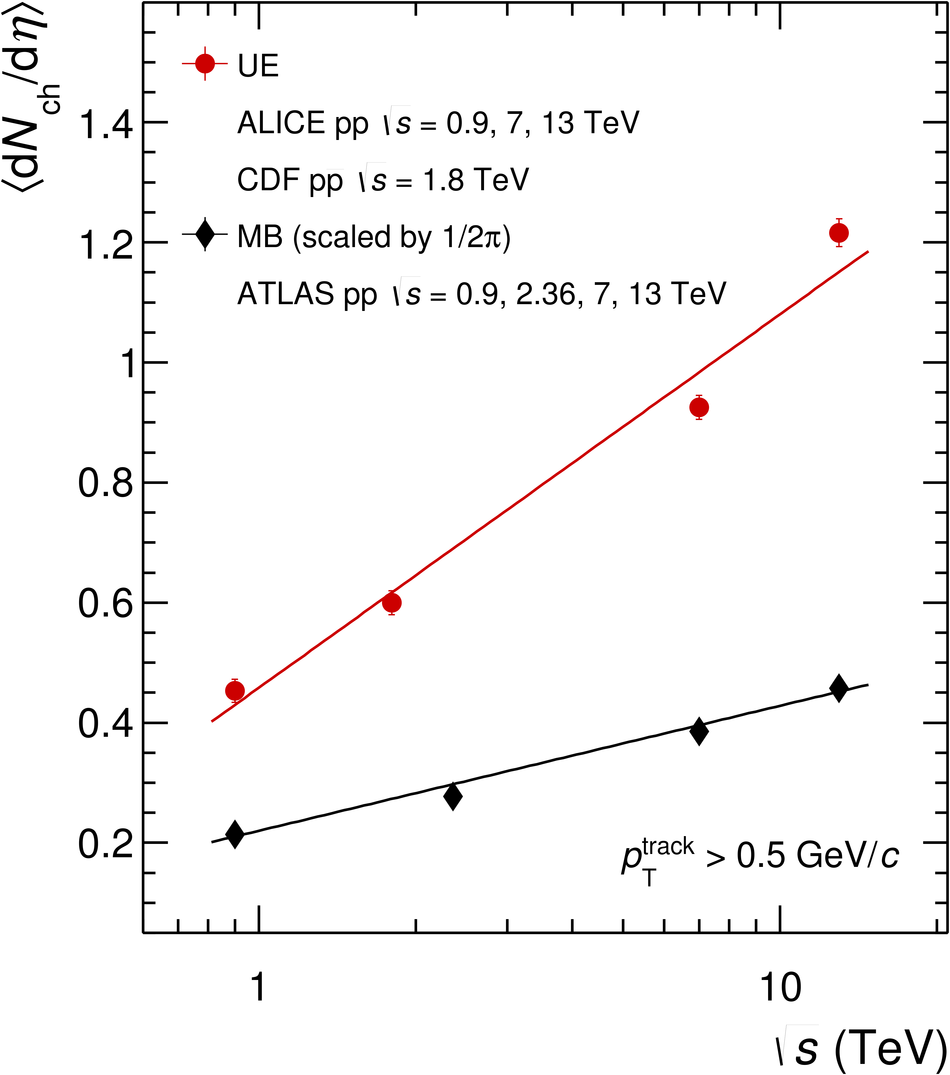 |