Number density Nch (left) and ∑ pT (right) distributions as a function of pTleading along with the MC simulations in Transverse region for three transverse momentum thresholds of pTtrack > 0.15, 0.5, and 1.0 GeV/c. The shaded areas represent the systematic uncertainties and vertical error bars indicate statistical uncertainties for the data. No uncertainties are shown for the MC simulations. | 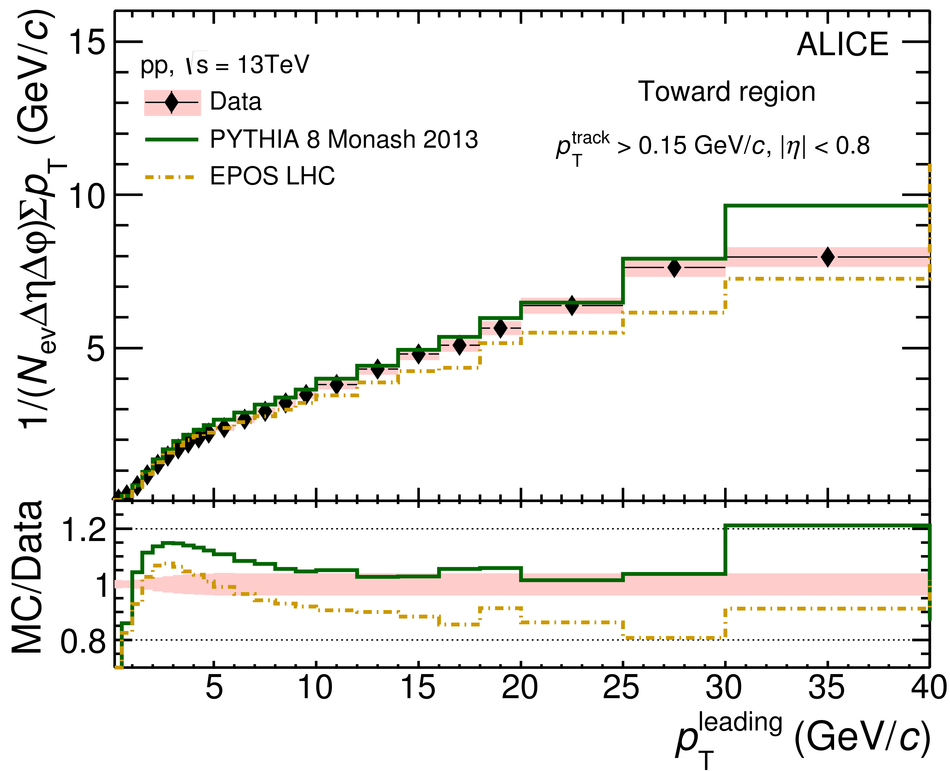 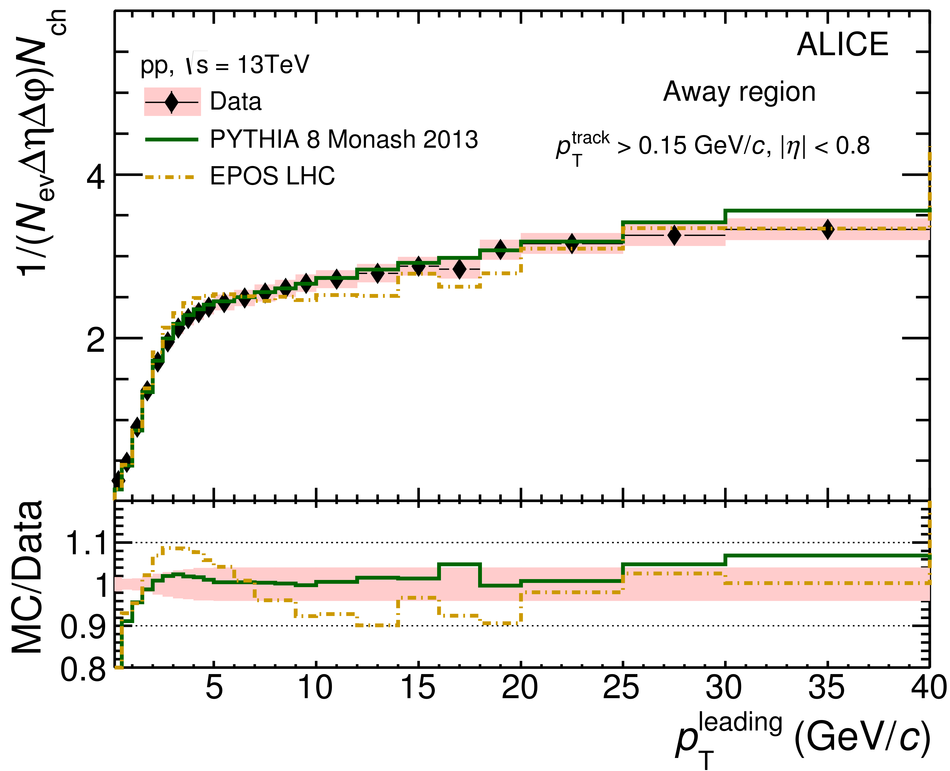 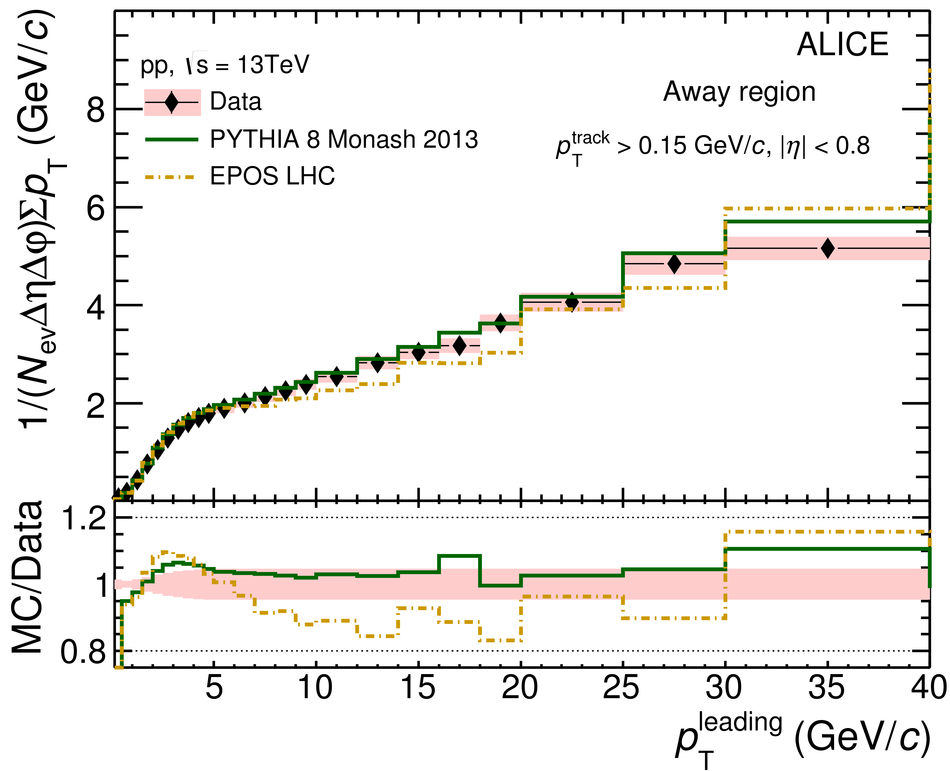 |
![[png]](https://alice-publications.web.cern.ch/sites/default/files/papers/5649/UE13TeV_Transverse_pT_015-101086.png)
![[png]](https://alice-publications.web.cern.ch/sites/default/files/papers/5649/UE13TeV_Transverse_SumpT_015-101091.png)
![[png]](https://alice-publications.web.cern.ch/sites/default/files/papers/5649/Transverse_Pt-101100.png)