Illustration of the links between different baryon--antibaryon pairs through the residual correlation. Main contributions to the $\rm p\overline{p}$ correlation function are marked in blue, to the $\rm p\overline{\Lambda}$ in yellow and to the $\Lambda\overline{\Lambda}$ in red. Solid lines show connections between studied pairs, while dashed lines present other major residual contributions that are unique for a given system. | 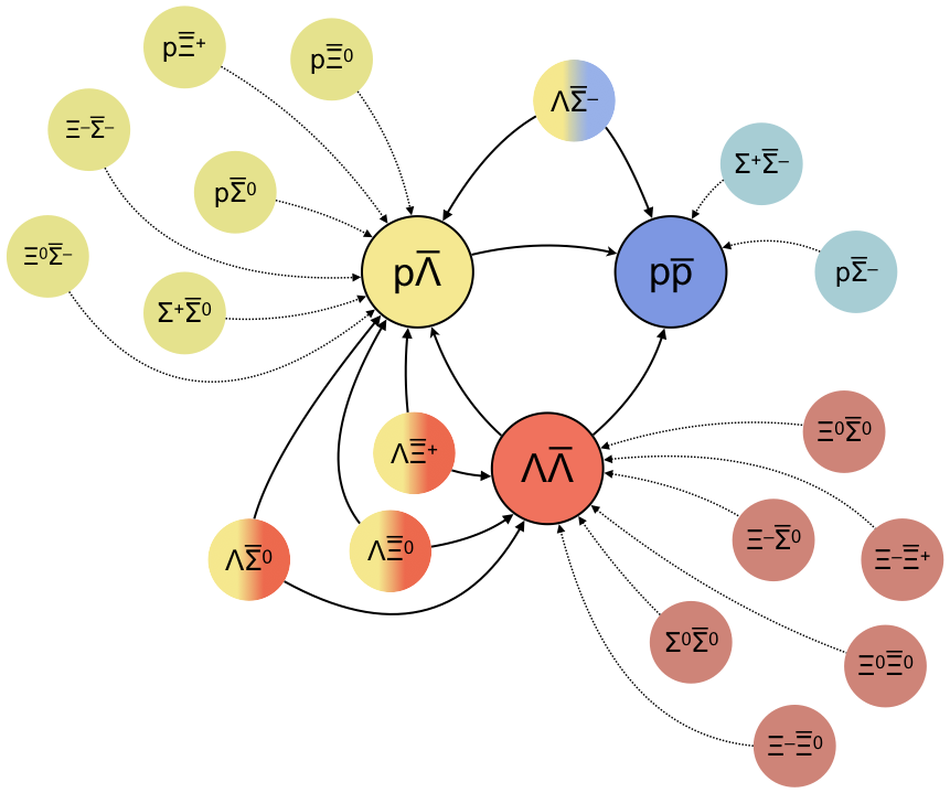 |