Average D-meson and charged-particles $\Qcp$ using the yields measured in 0--10\%, 10--20\%, 20--40\%, and 40--60\% as numerators and the yield in 60--100\% as the denominator. The vertical bars and the empty boxes represent the statistical and systematic uncertainties. The colour-filled boxes at $\Qcp$ $=1$ represent the normalisation uncertainties on the $ \langle \TpPb \rangle$ | 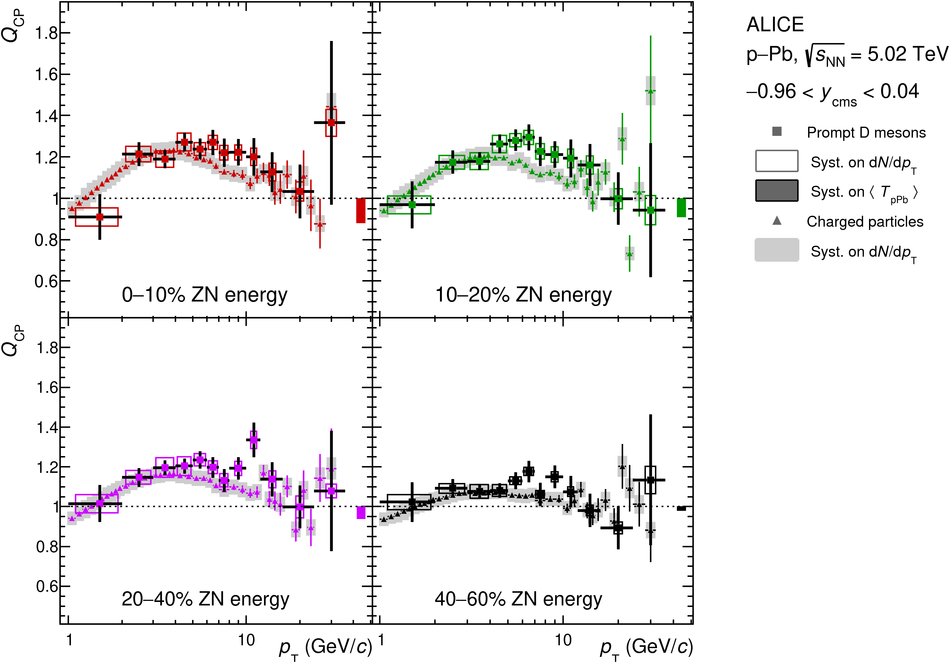 |