Examplary invariant-mass distributions for $\Dzero$, $\Dplus$, and $\Ds$ candidates (plus charge conjugates) and the mass difference $\Delta M = M_{{\rm K} \pi\pi} -M_{{\rm K} \pi}$ for $\Dstar$ candidates (and charge conjugates) in minimum-bias p--Pb collisions at $\sqrtsNN=5.02 \tev$ The dashed curves represent the fit applied to the background, while the solid lines represent the total fit function In the case of the $\Dzero$ meson, the contribution of signal reflections in the invariant-mass distribution is shown using a gray dot-dashed line. In the case of the $\Ds$ invariant-mass distribution, an additional Gaussian is used in the fit function in order to describe the $\Dplus$ signal peak on the left side of the $\Ds$ signal. | 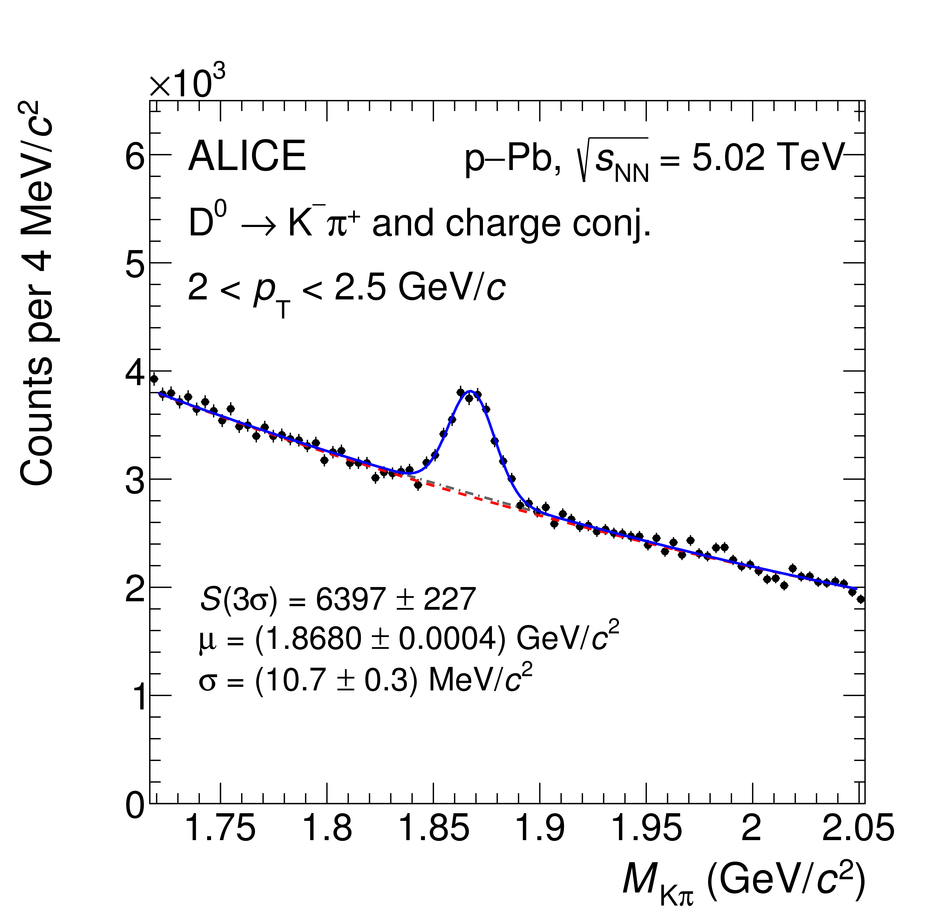 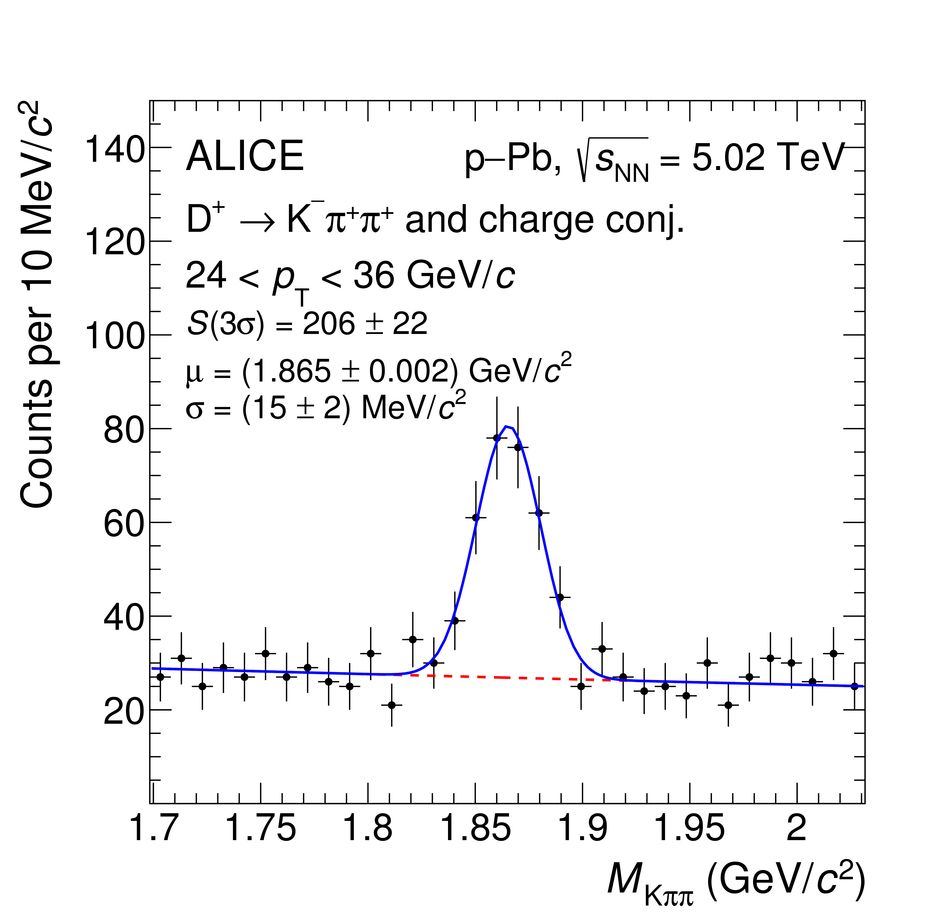 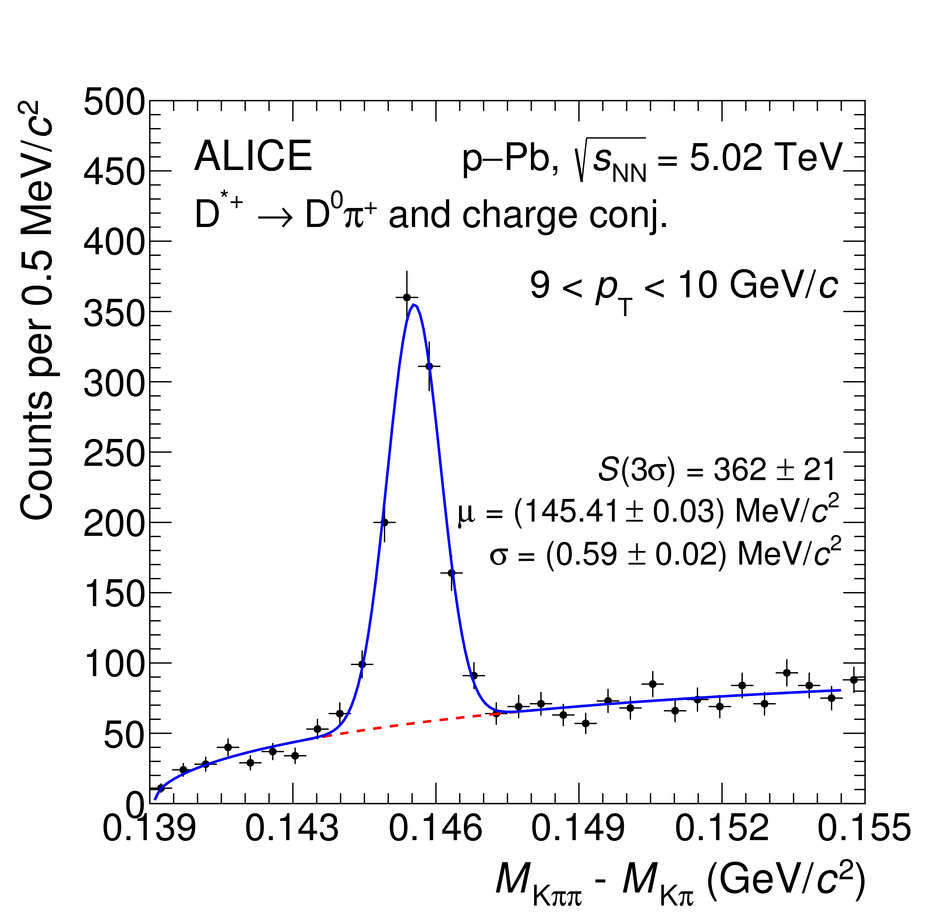 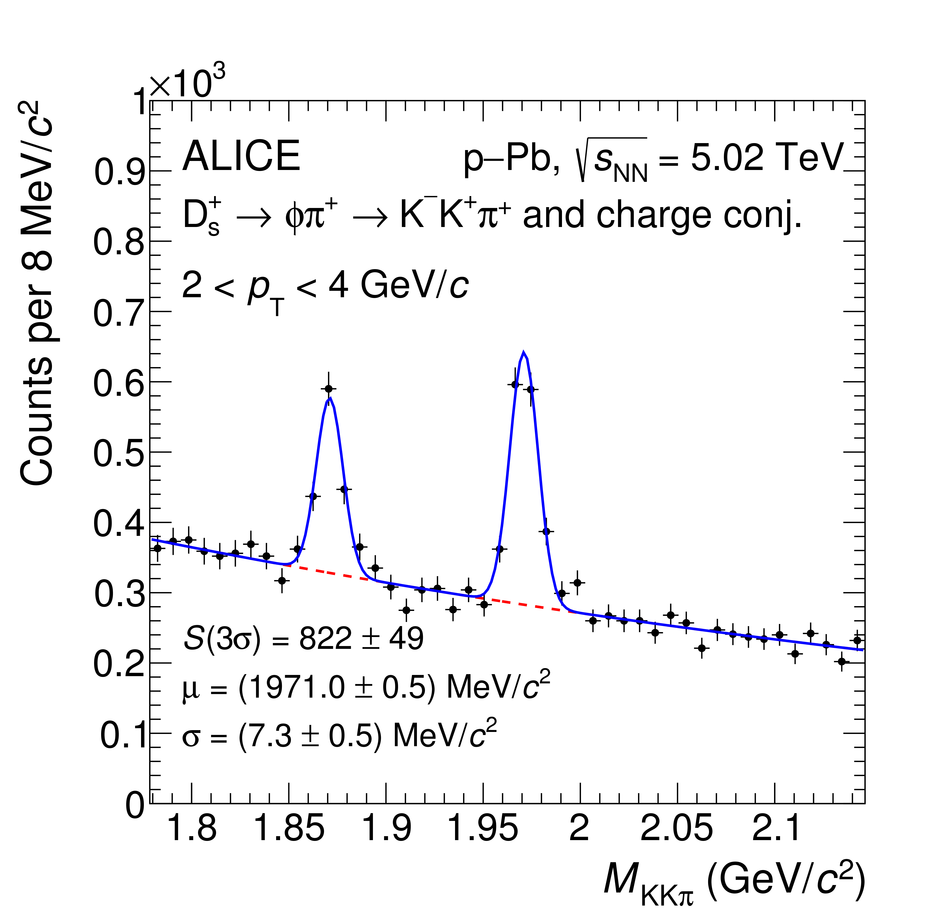 |