The distribution of the specific ionization energy loss (\dEdx) in the TPC of the candidate tracks compared to the expected value for $^3$He or $^3$H ($n_\sigma^\mathrm{TPC}$) in the \pt range of 1.5 $\leq\pt < 2.0$ GeV/$c$ and 2.0 GeV/$c$ $\le \pt < 2.5$ GeV/$c$ for $^3$He (left panel) and $^3$H (right panel), respectively. The background, which is visible as a slope on the left side of the signal, is fitted with a Gaussian function shown in red to estimate the contamination. | 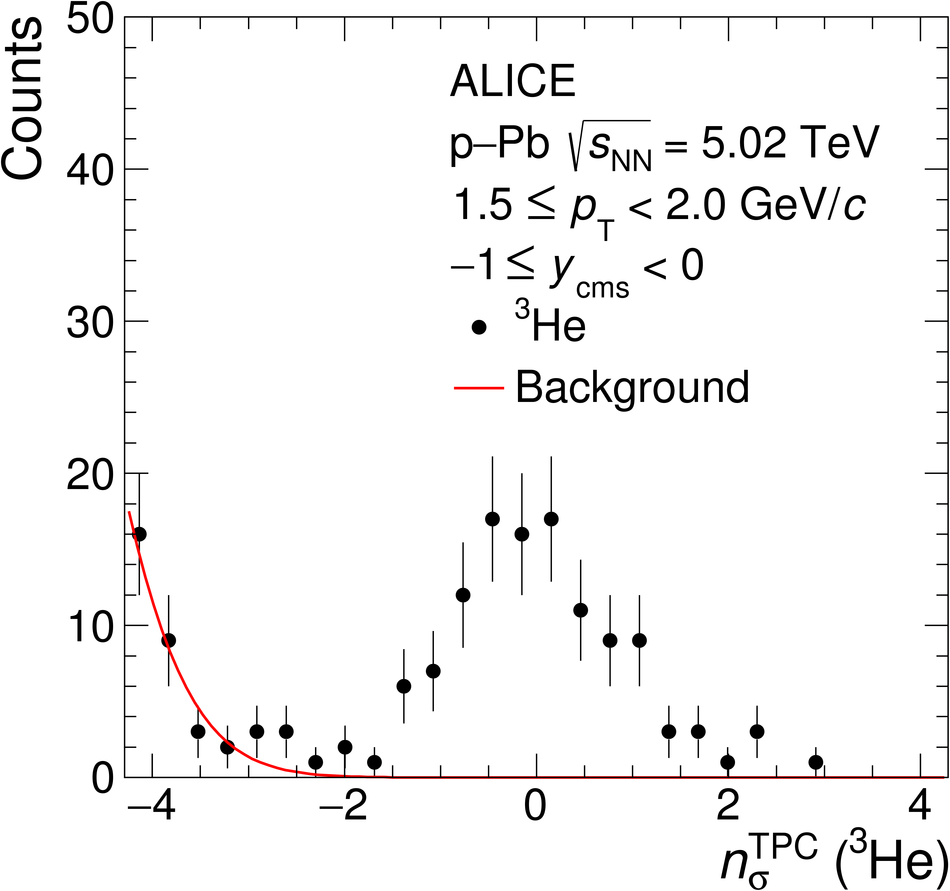 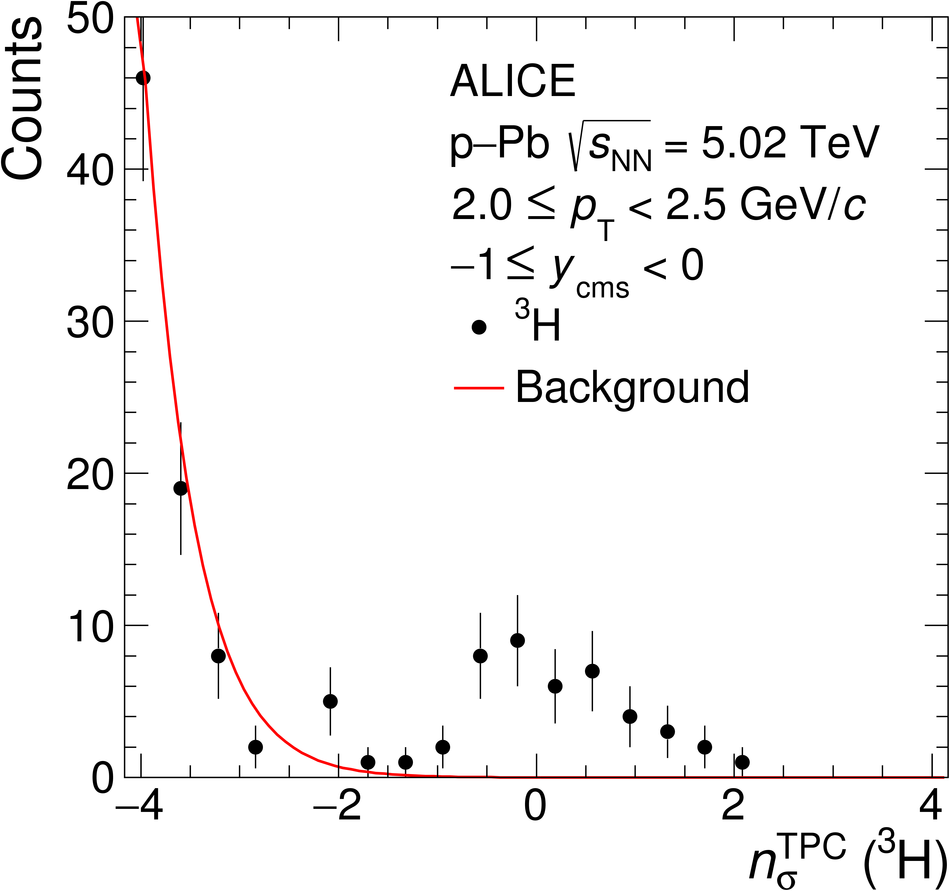 |