(Top) K/\ppi and p/\ppi ratios in \pbpb collisions at \snnF TeV in 70-80\% centrality class, compared to iEBE-VISHNU, McGill and EPOS3 model predictions, see text for details The statistical and systematic uncertainties are shown as error bars and boxes around the data points, respectively For model predictions the statistical uncertainties are represented by the band width (Bottom) Data-to-model ratio, the statistical and systematic uncertainties are shown as error bars and bands around the data points, respectively. | 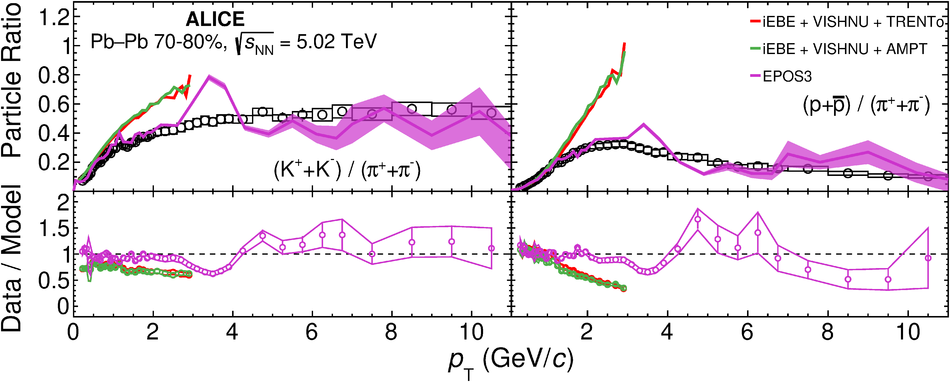 |