Transverse momentum integrated K/\ppi (top) and p/\ppi (bottom) ratios as a function of \avdNchdeta in \pbpb collisions at \snnF TeV, compared to \pbpb at 2.76 TeV The values in pp collisions at \sF and 2.76 TeV are also shown The empty boxes show the total systematic uncertainty; the shaded boxes indicate the contribution uncorrelated across centrality bins (not estimated in \pbpb collisions at \snnT TeV) Continuous lines represent the Bayesian analysis predictions. | 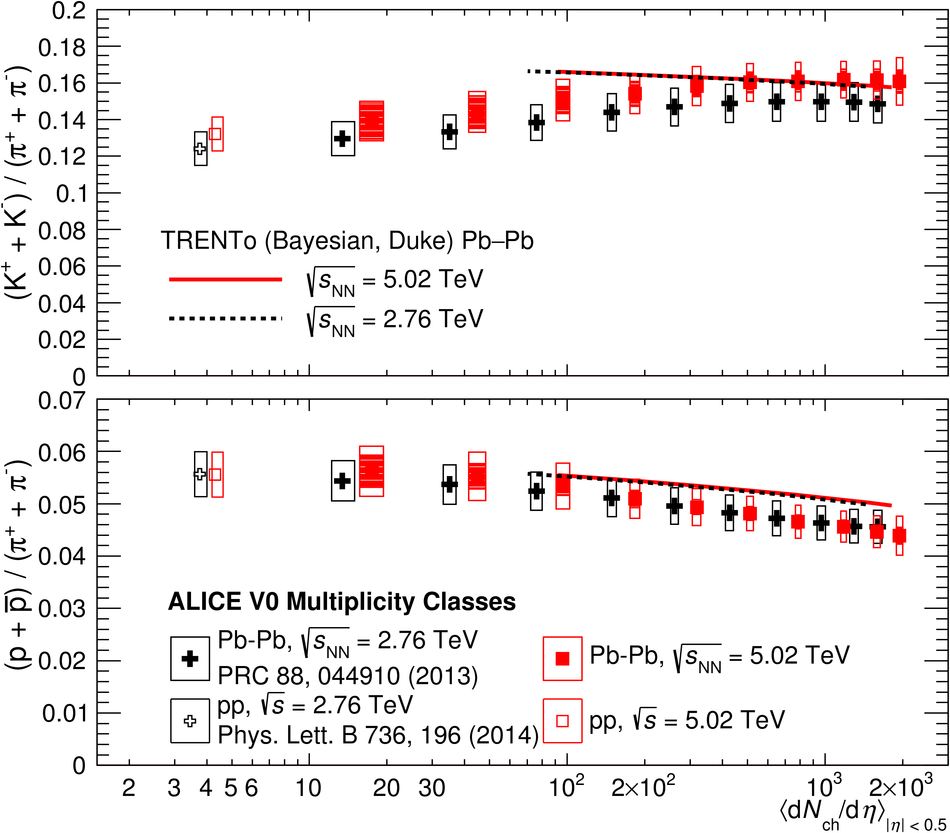 |