Transverse momentum distributions of dileptons around the \jpsi mass for the dielectron (upper left) and dimuon (upper right) samples for the central analysis and dimuon samples for the semi-forward (lower left) and semi-backward (lower right) analyses. In all cases the data are represented by points with error bars. The blue, magenta (dash) and green (dash-dot-dot) lines correspond to Monte Carlo templates for \jpsi\ coming from exclusive photoproduction off protons or off lead and continuous dilepton production respectively. The red (dash-dot) line is a template for dissociative and hadronic background obtained from data. The solid black line is the sum of all contributions. | 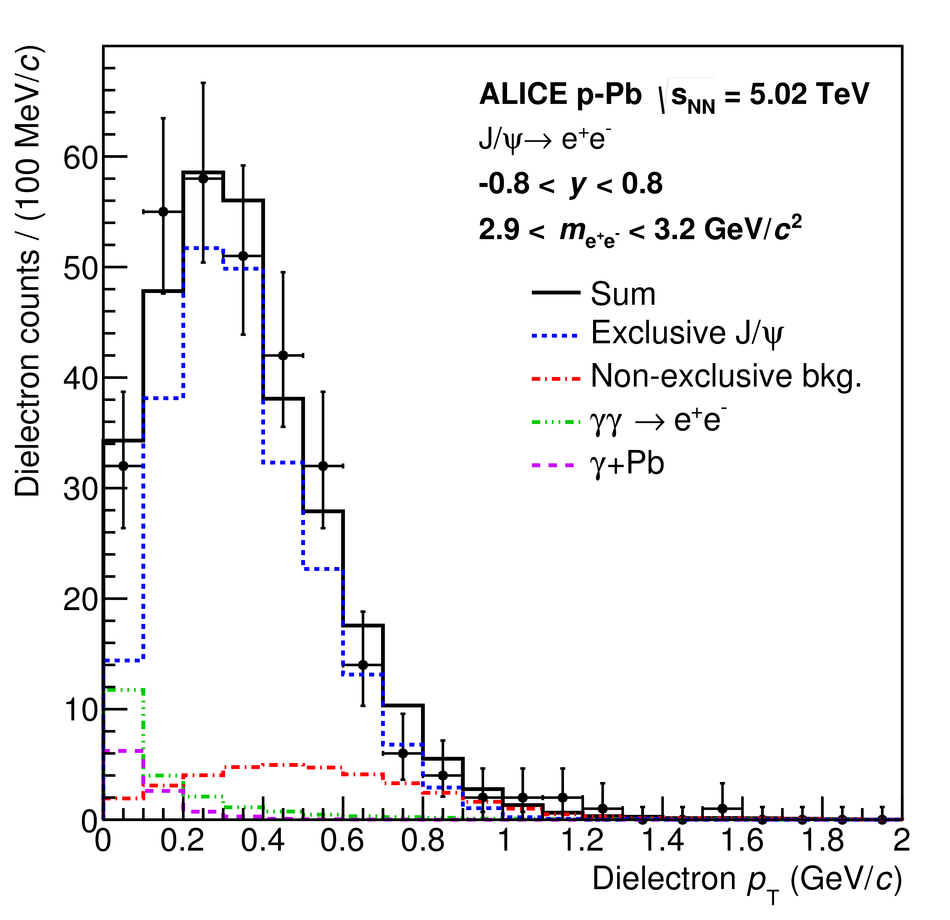 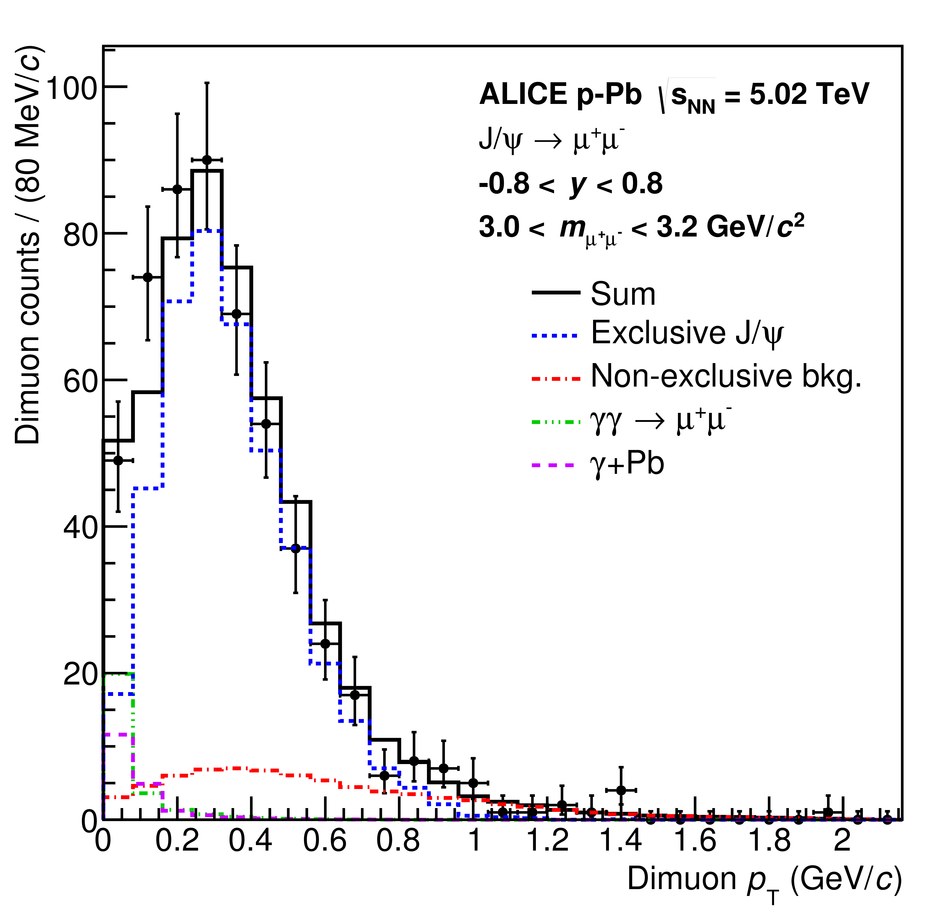 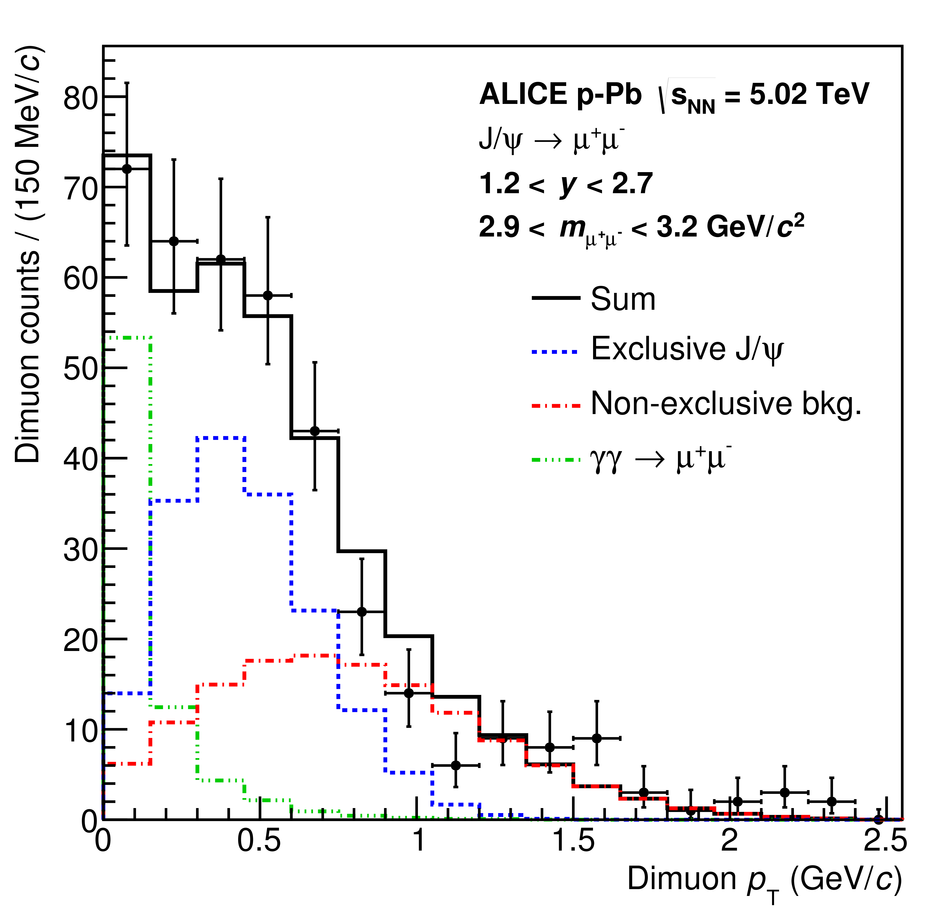 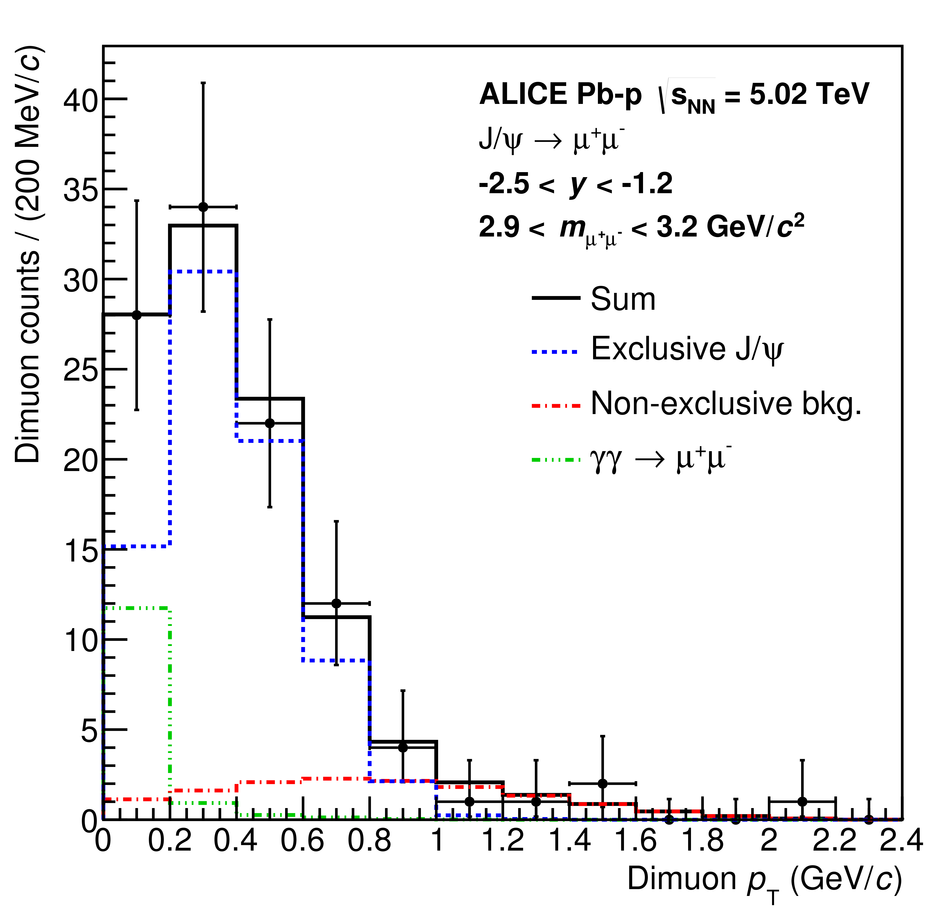 |