(left) \pt-differential yields of \Lambdastar at midrapidity, \yless{0.5}, in the centrality classes 0--20\%, 20--50\%, and 50--80\% The solid and dashed curves represent predictions from the Blast-Wave model (normalisation fitted to the data) and EPOS3, respectively. The horizontal error bars represents the width of the measured \pt interval. (right) Ratio of the data to the Blast-Wave and EPOS3 predictions. | 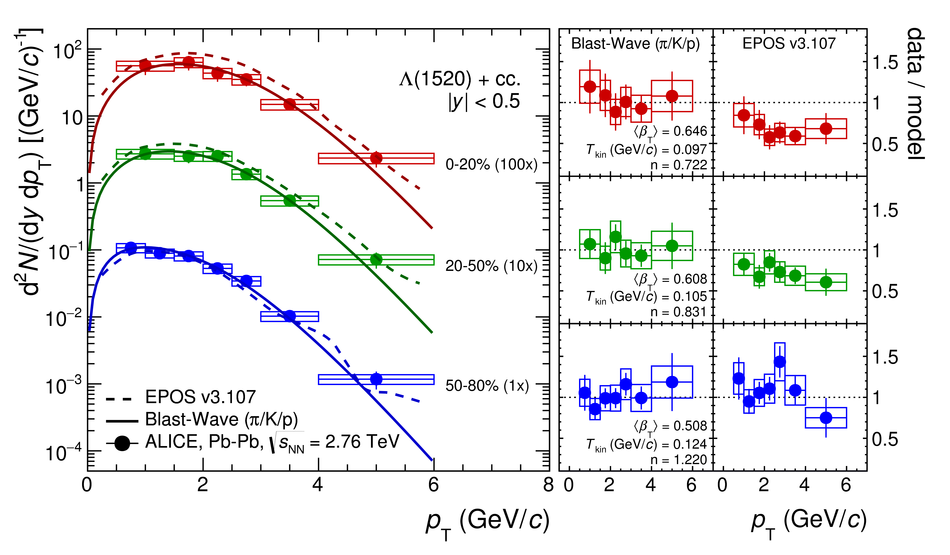 |