Example invariant-mass distributions of the \Lambdastardecay (and charged conjugate) reconstruction after subtraction of the mixed-event background The solid line represents the global fit (signal + residual background) to the data while the dashed line indicates the estimated residual background The error bars indicate the statistical uncertainties of the data. | 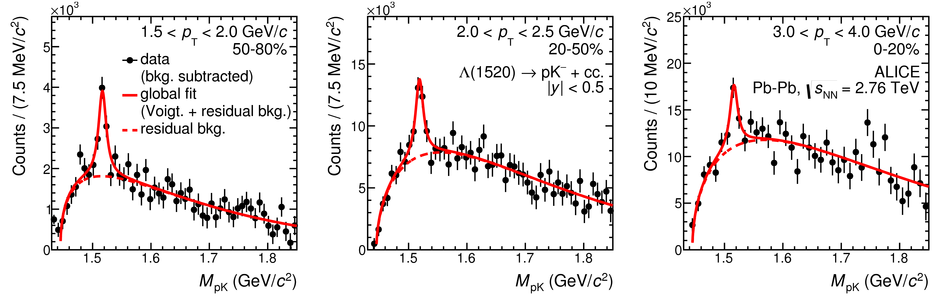 |