Mass distributions of selected dileptons for the dielectron (upper left) and dimuon (upper right) samples for the central analysis and dimuon samples for the semi-forward (lower left) and semi-backward (lower right) analyses. In all cases the data are represented by points with error bars The solid blue line is a fit to a Crystal-Ball function plus an exponential distribution, where this last contribution is shown by a dotted red line. | 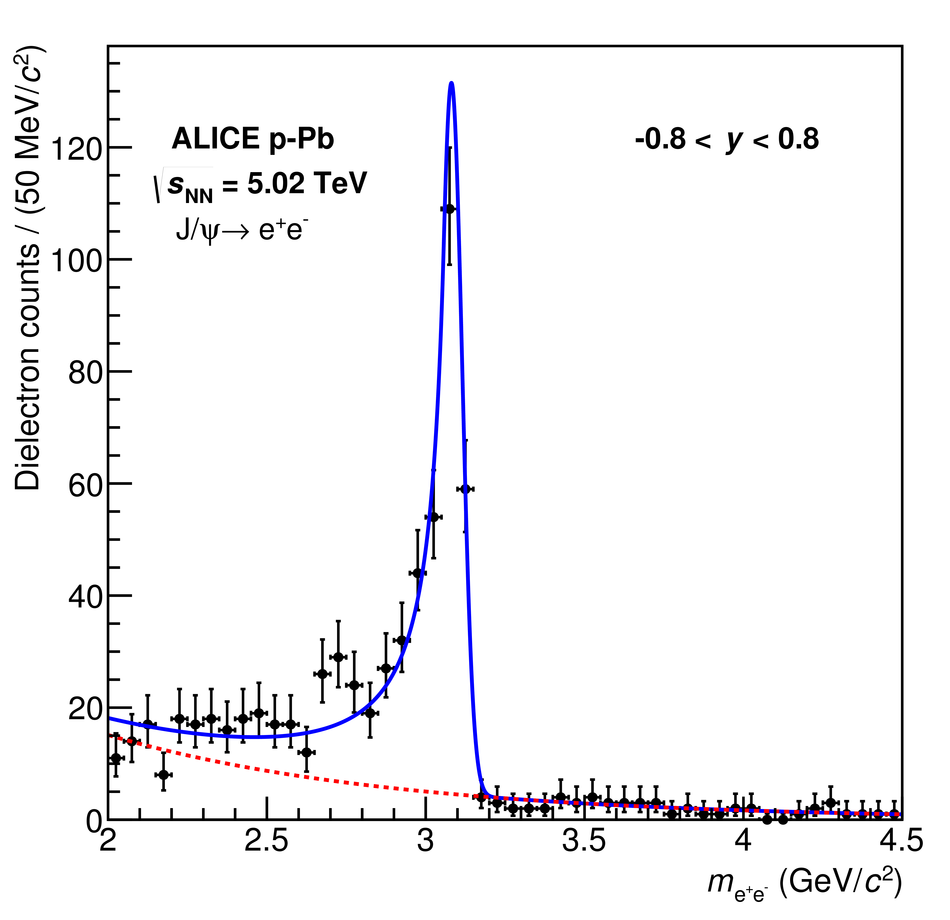 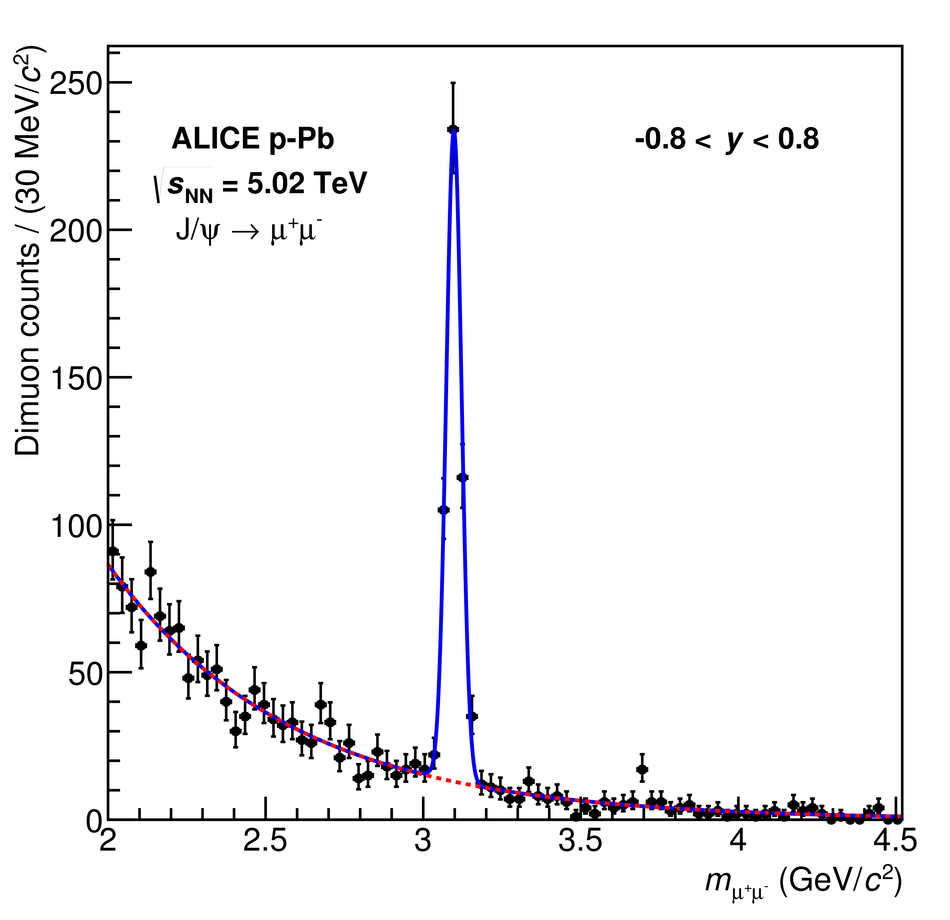 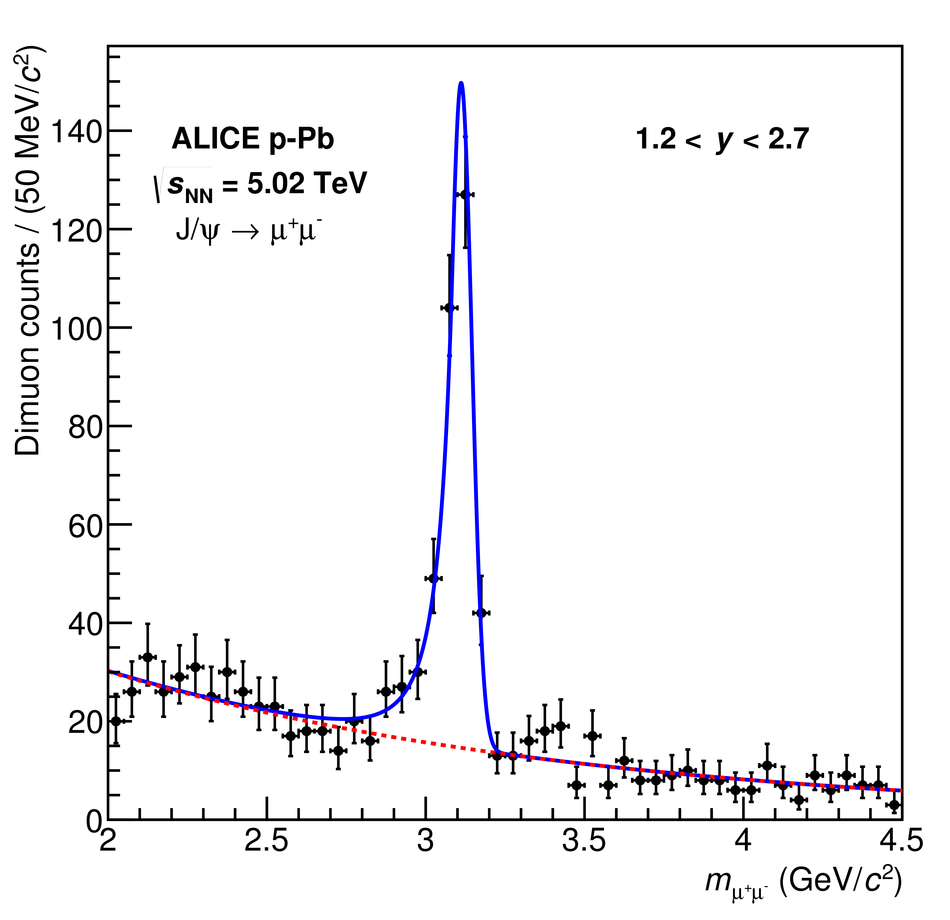 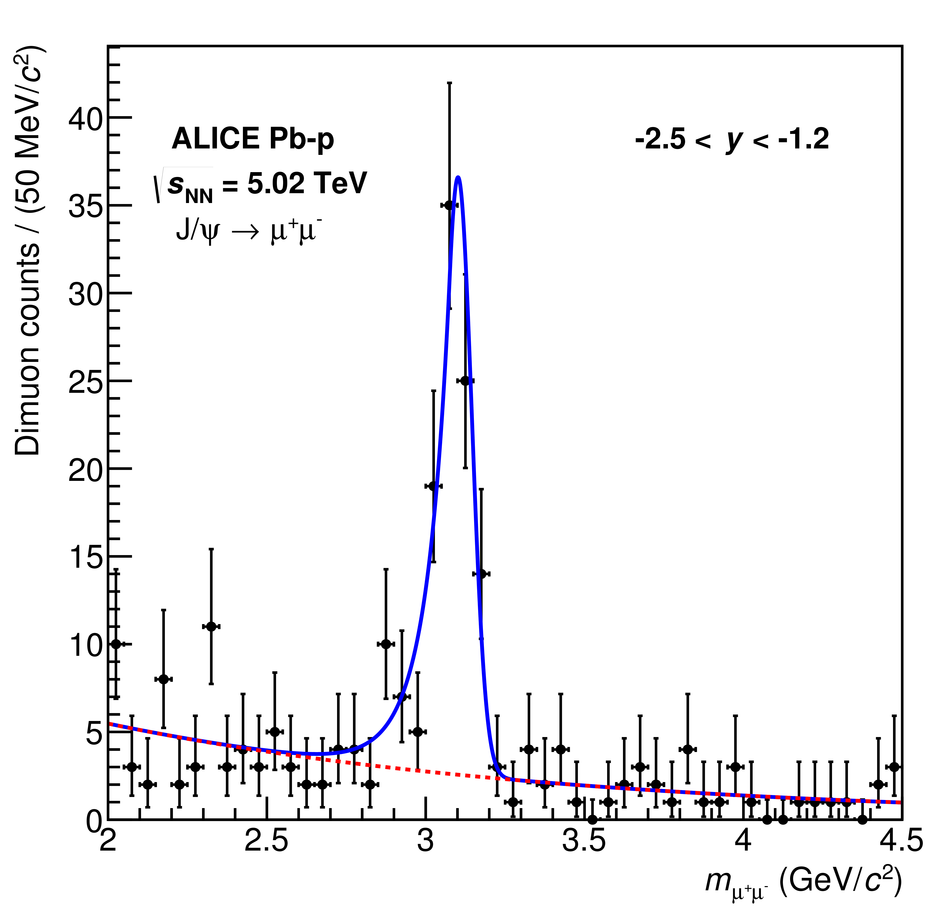 |