Measurements of the inclusive J/$\psi$ yield as a function of charged-particle pseudorapidity density ${\rm d}N_{\rm ch}/\rm{d}\eta$ in pp collisions at $\sqrt{s}$ = 13 TeV with ALICE at the LHC are reported. The J/$\psi$ meson yield is measured at midrapidity ($|y|<~0.9$) in the dielectron channel, for events selected based on the charged-particle multiplicity at midrapidity ($|\eta|<~1$) and at forward rapidity ($-3.7<~\eta<~-1.7$ and $2.8<~\eta<~5.1$); both observables are normalized to their corresponding averages in minimum bias events. The increase of the normalized J/$\psi$ yield with normalized ${\rm d}N_{\rm ch}/\rm{d}\eta$ is significantly stronger than linear and dependent on the transverse momentum. The data are compared to theoretical predictions, which describe the observed trends well, albeit not always quantitatively.
PLB 810 (2020) 135758
HEP Data
e-Print: arXiv:2005.11123 | PDF | inSPIRE
CERN-EP-2020-088
Figure 1
Distribution of the corrected SPD tracklets \ntrcorr (left) and V0 amplitude (right) for the MB events as well as the HM- and EMCal-triggered events used in the analysis. The vertical lines indicate the used multiplicity intervals (see Table \ref{tab:mult}; the first bin spans from 0 to the position of the first line). For the HM-triggered events, the V0 amplitude distribution for a single data taking period is included for illustration (open squares). | 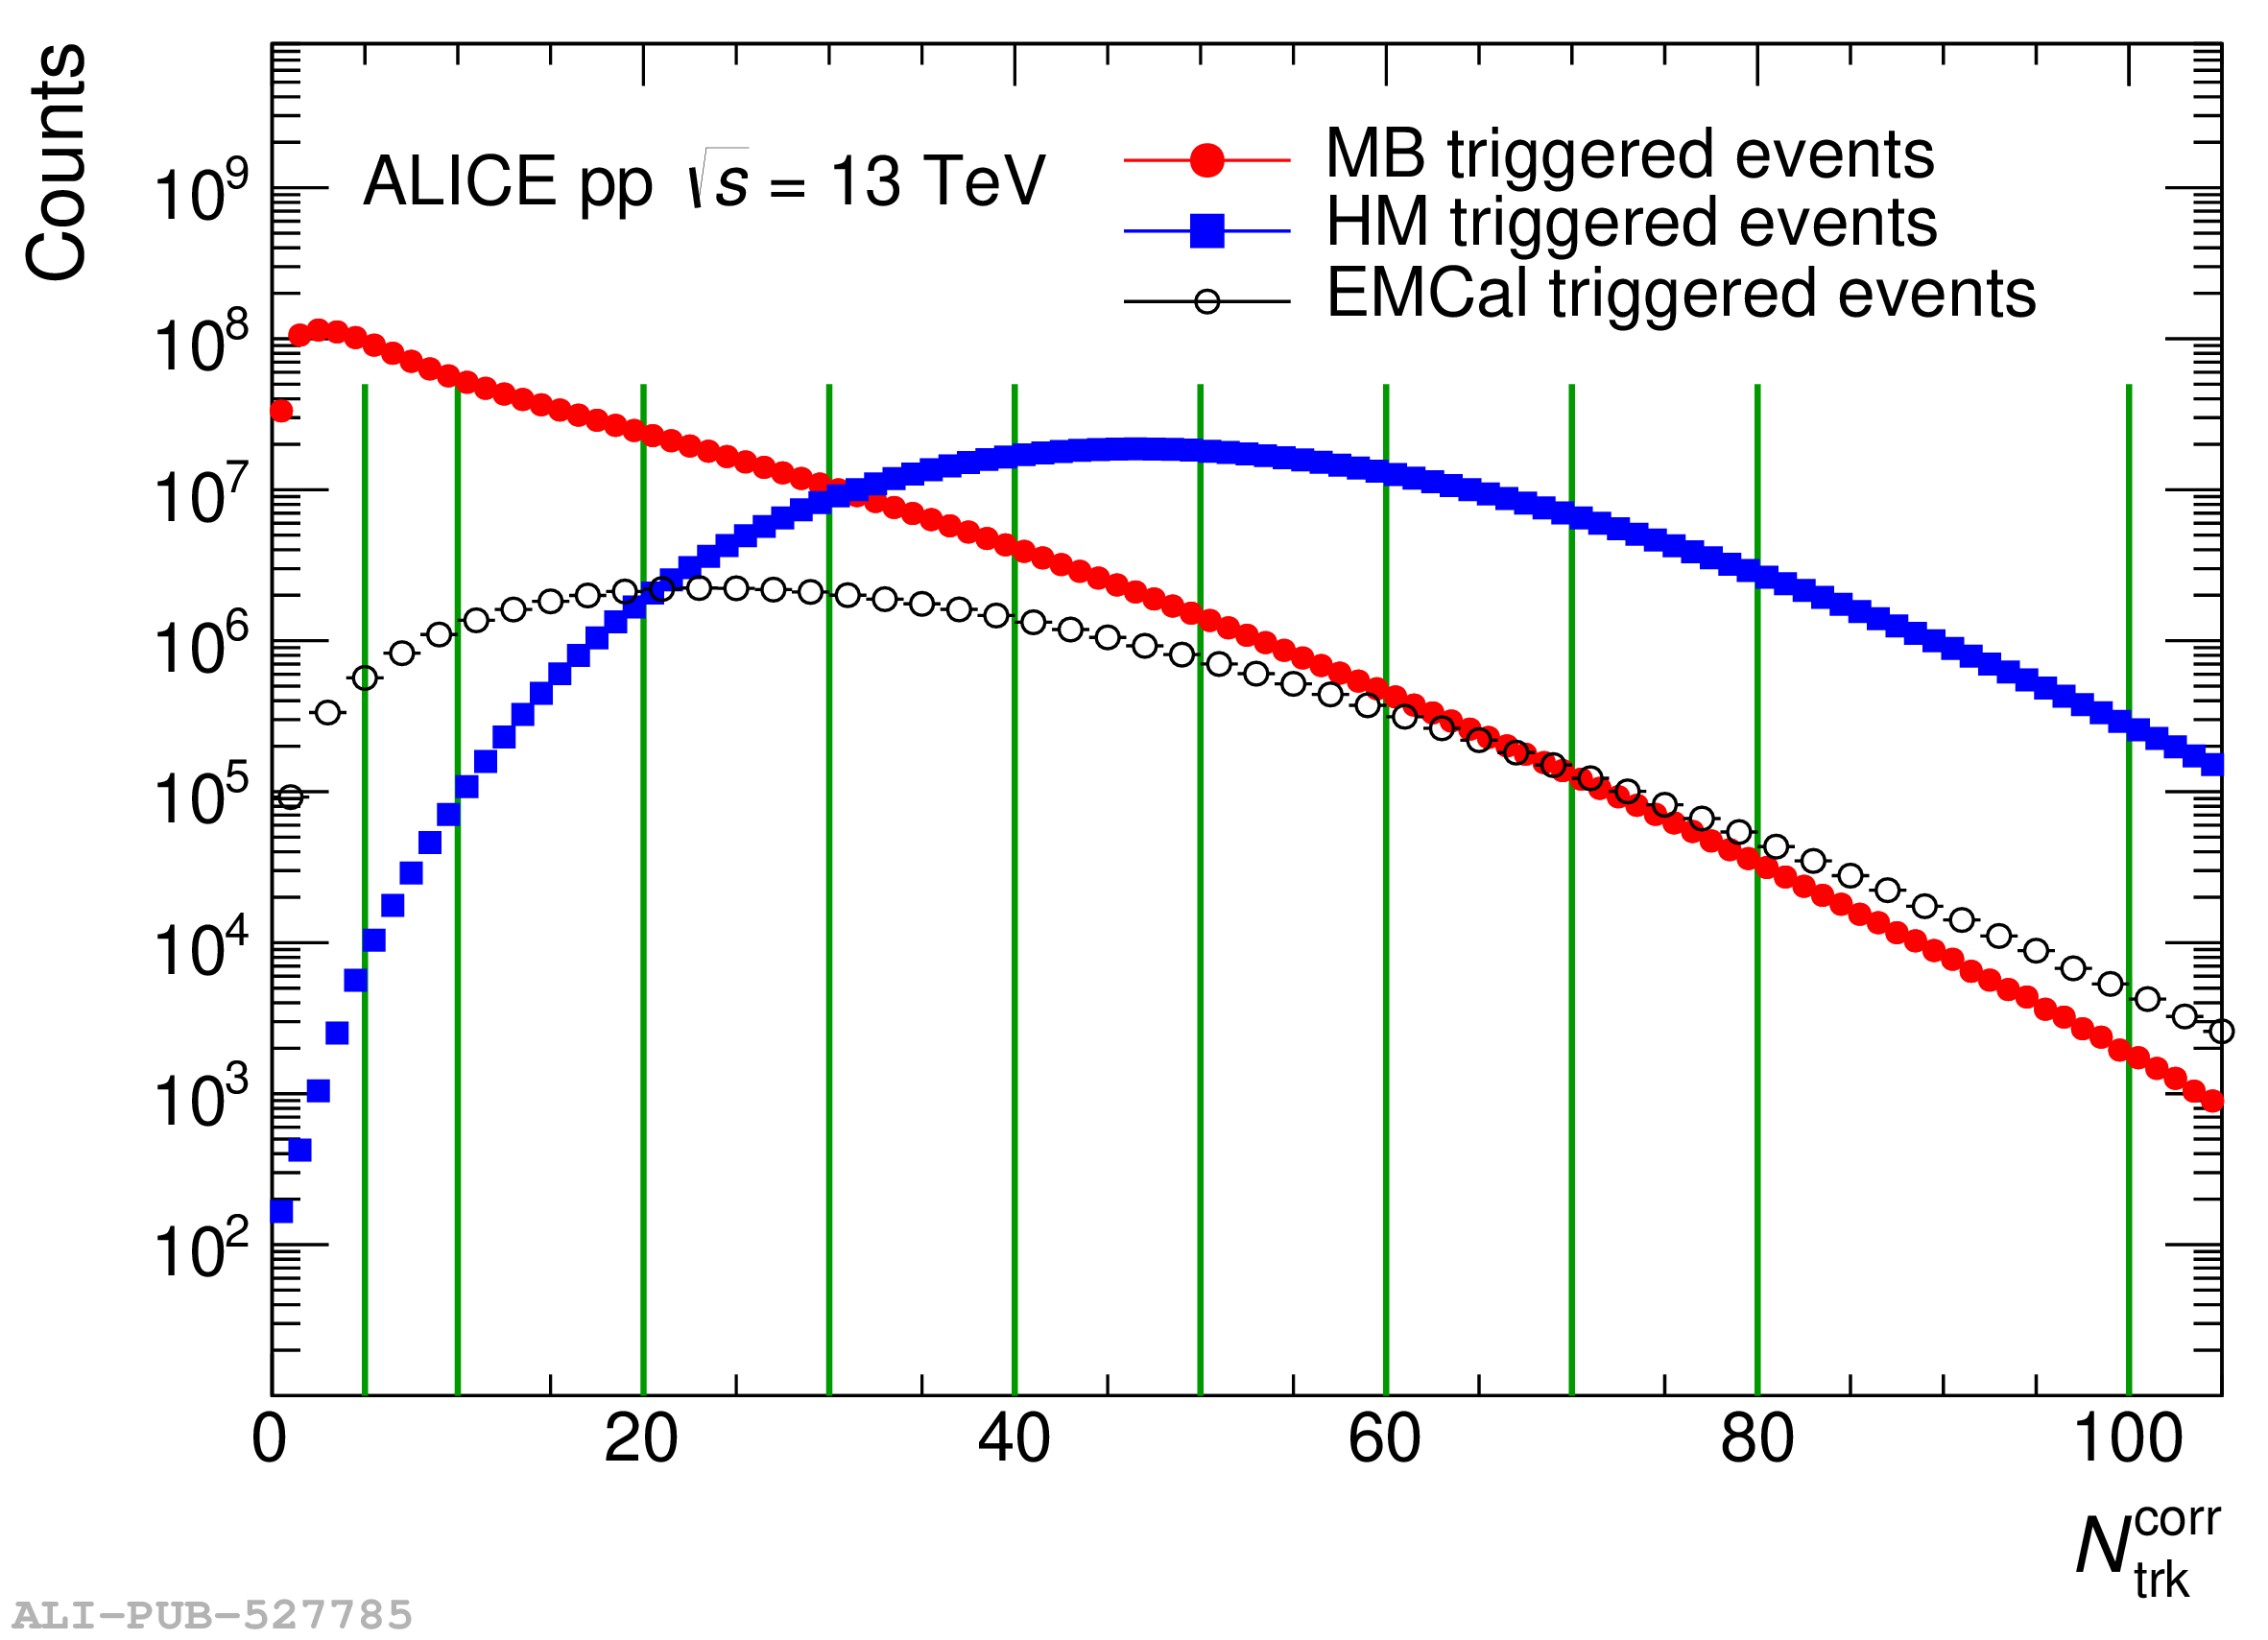 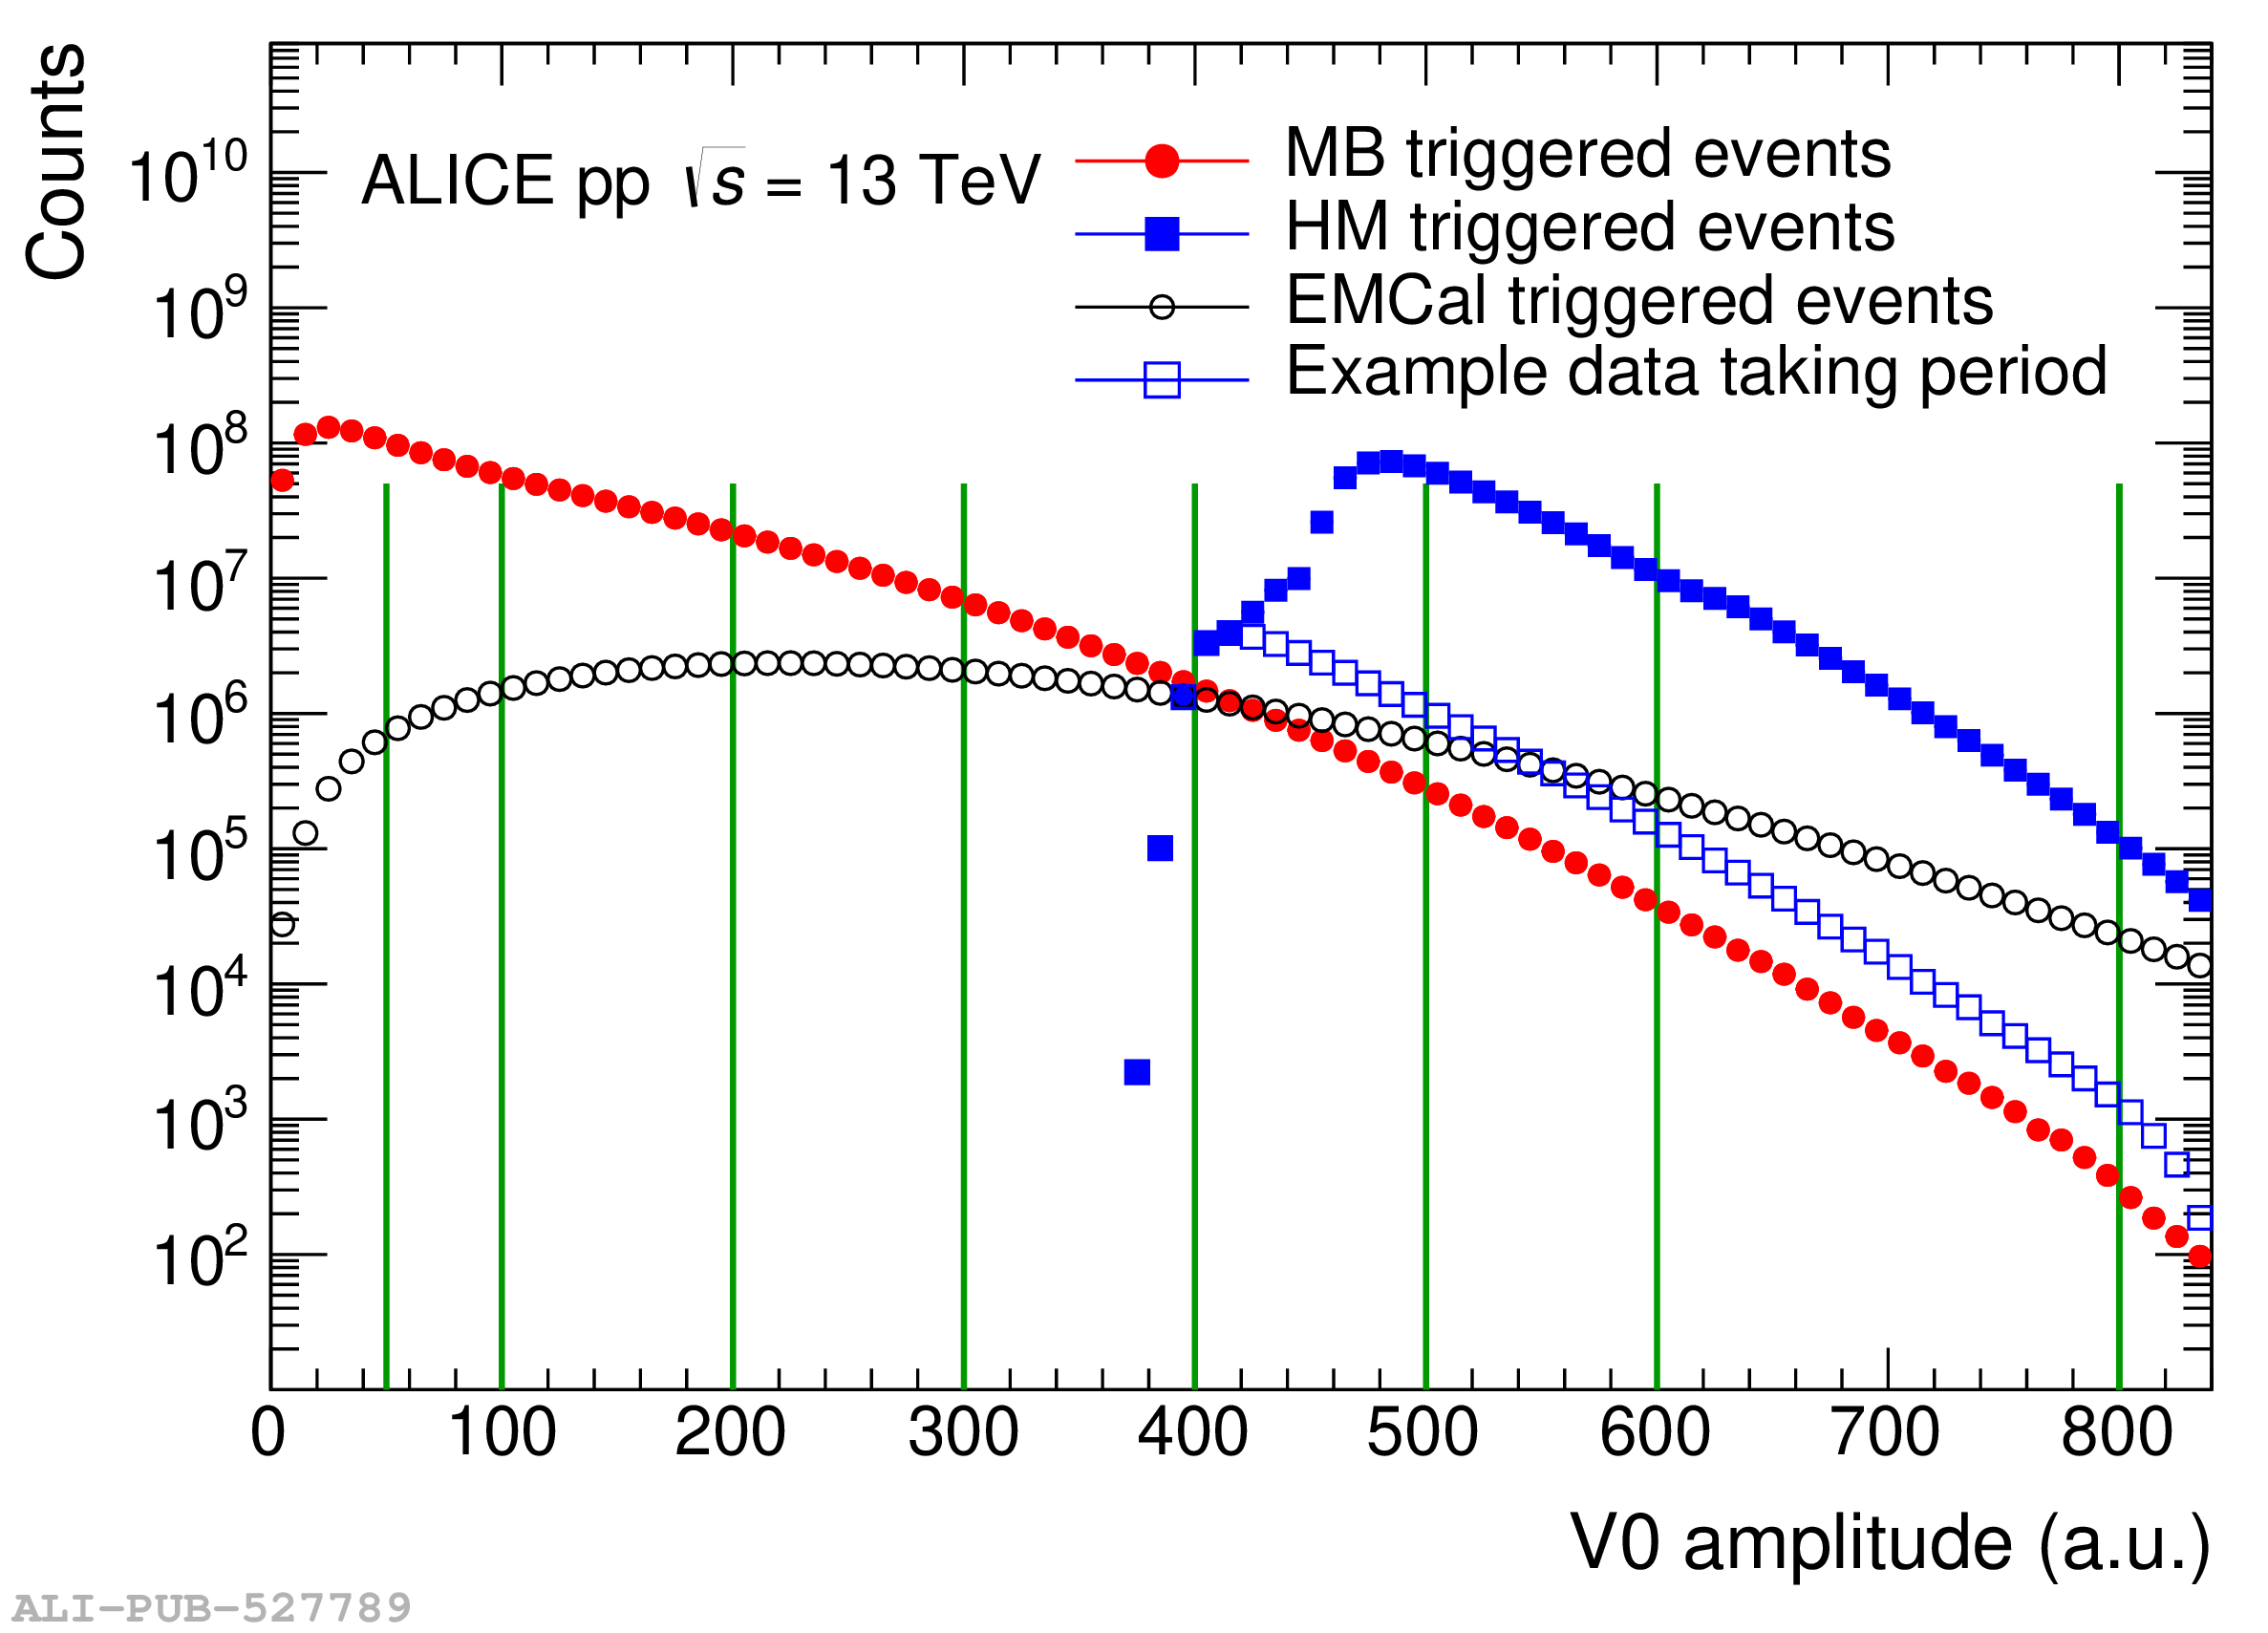 |

Figure 3
Top: Invariant mass distribution of electron-positron pairs for MB (left), HM (middle) and EMCal (right) triggers, together with combinatorial background estimation from the track-rotation method (blue lines in the left and middle panels) and the full background estimation (black squares). In the lower panels, the \jpsi signal obtained after background subtraction is shown together with the \jpsi signal shape from Monte Carlo simulations The entries contain a correction for the relative efficiency (see text) The vertical lines indicate the mass range for the signal counting. | 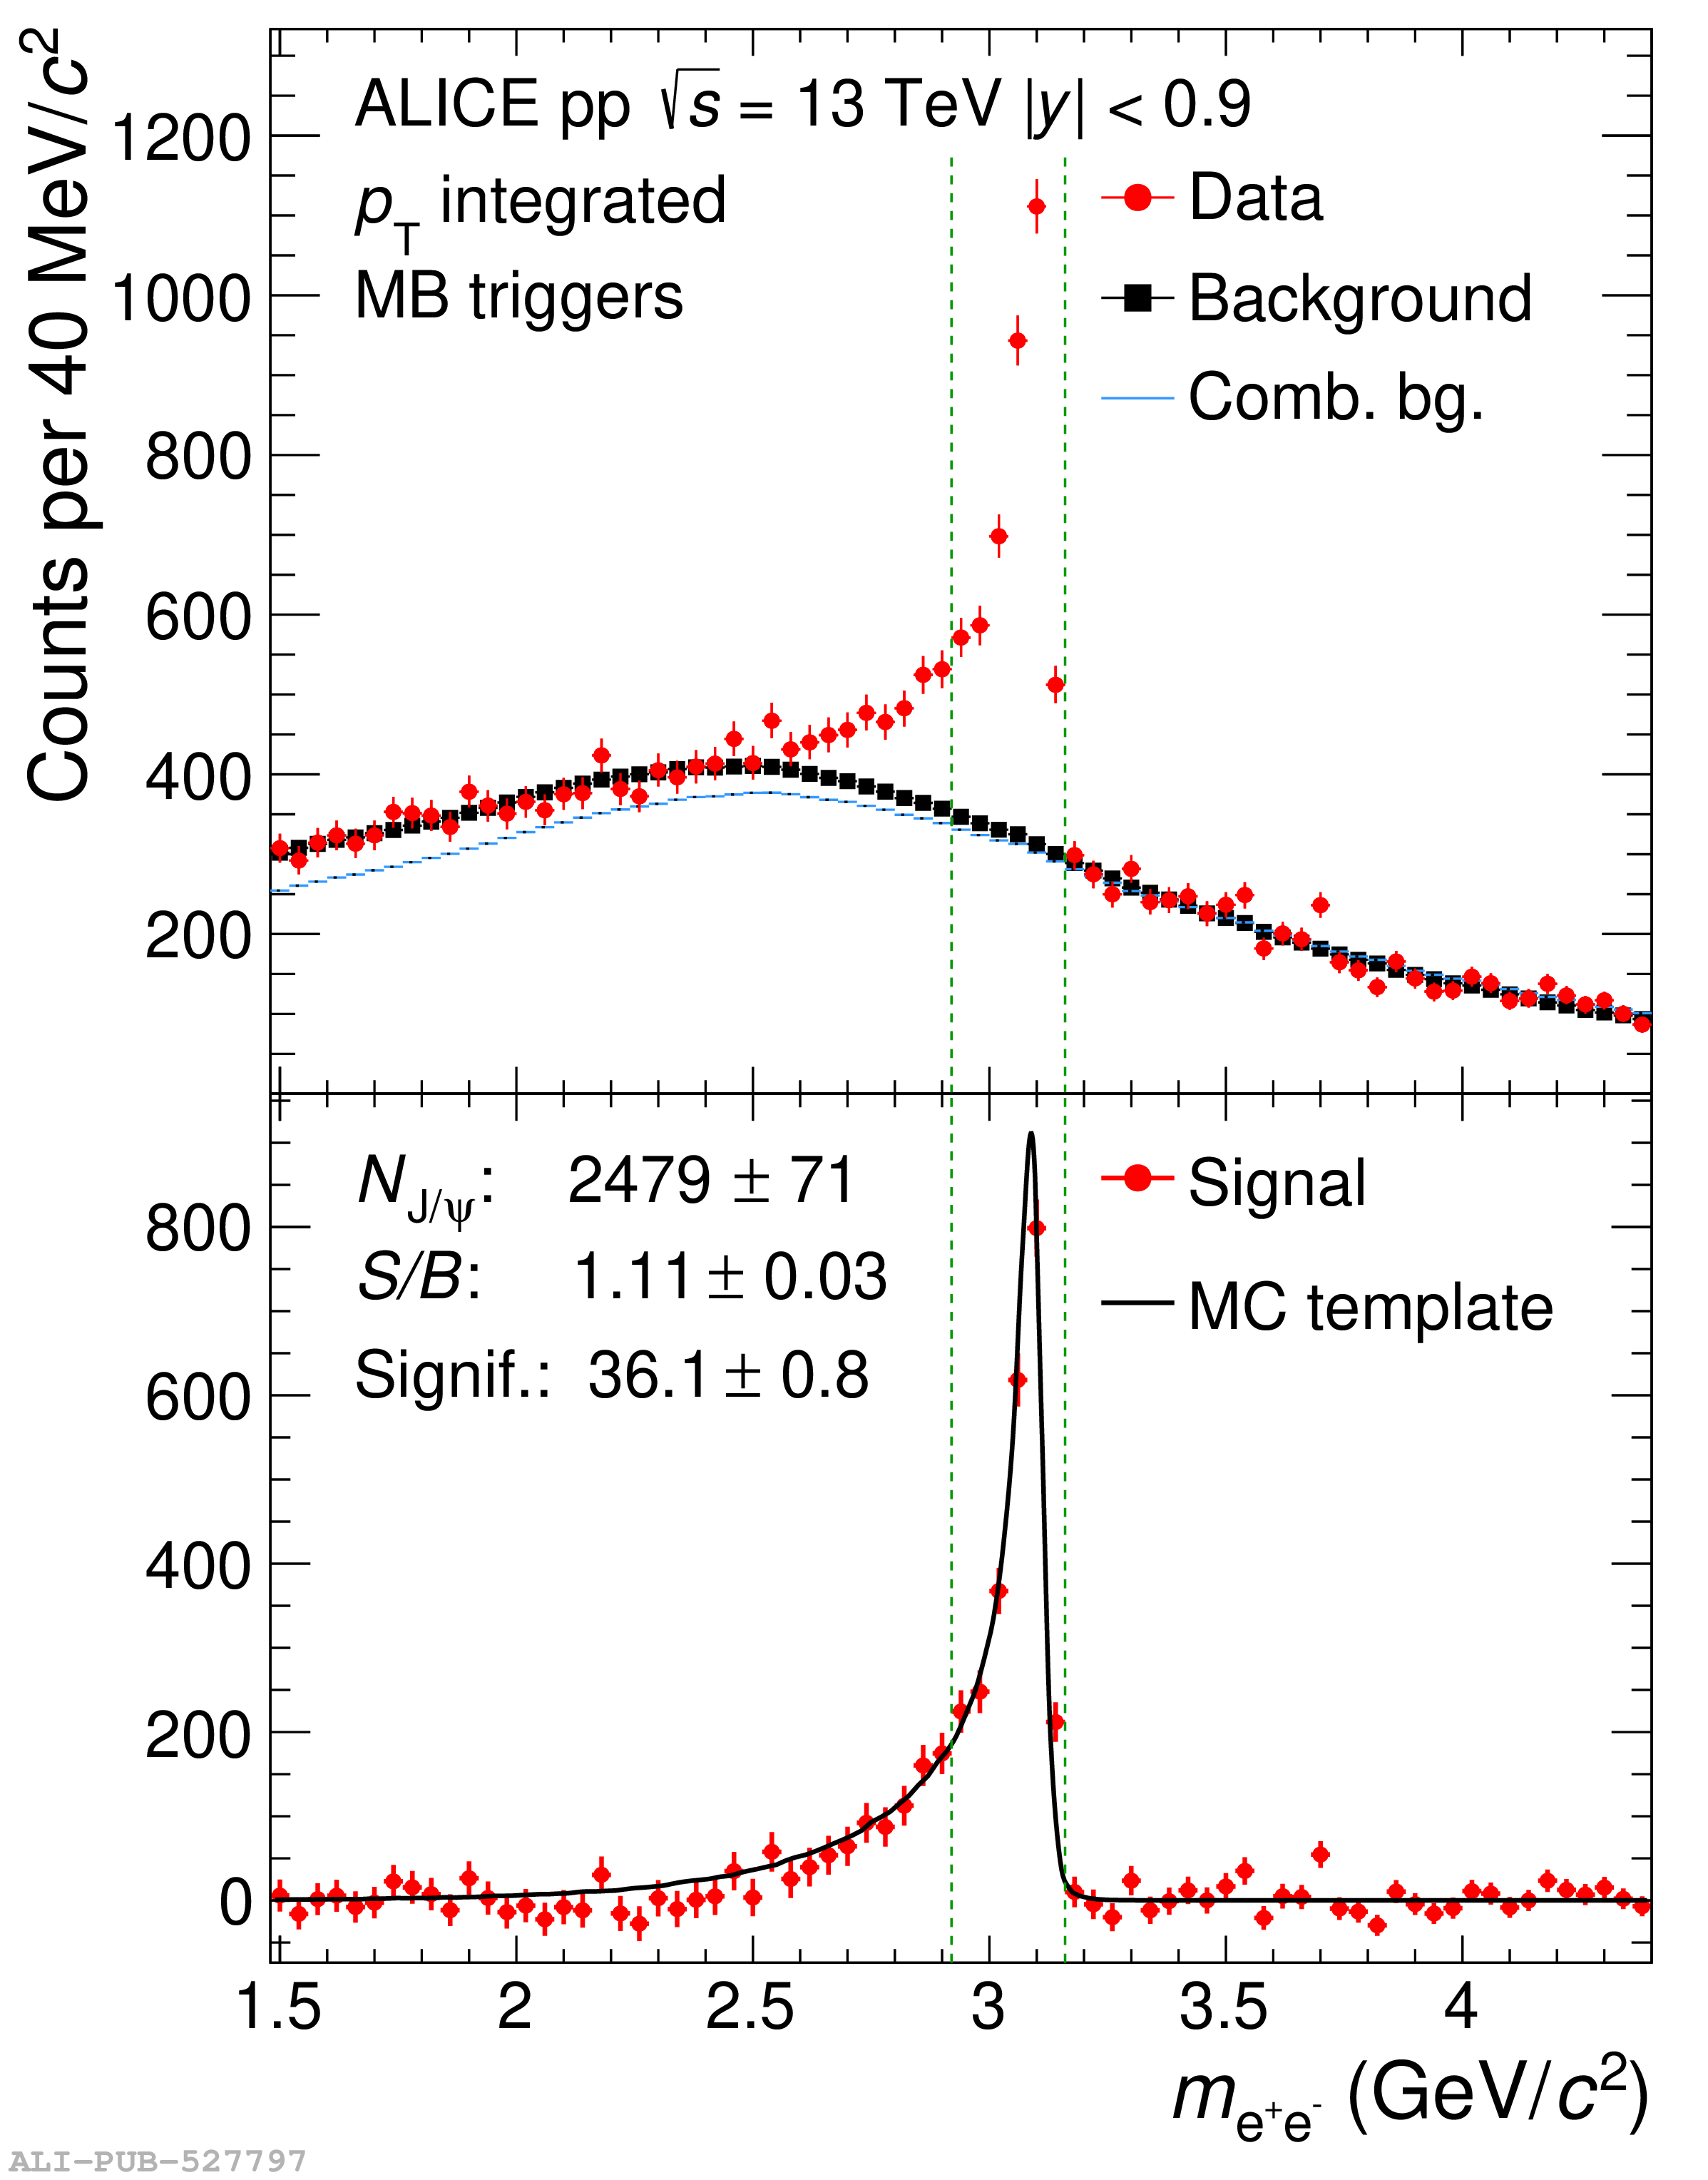 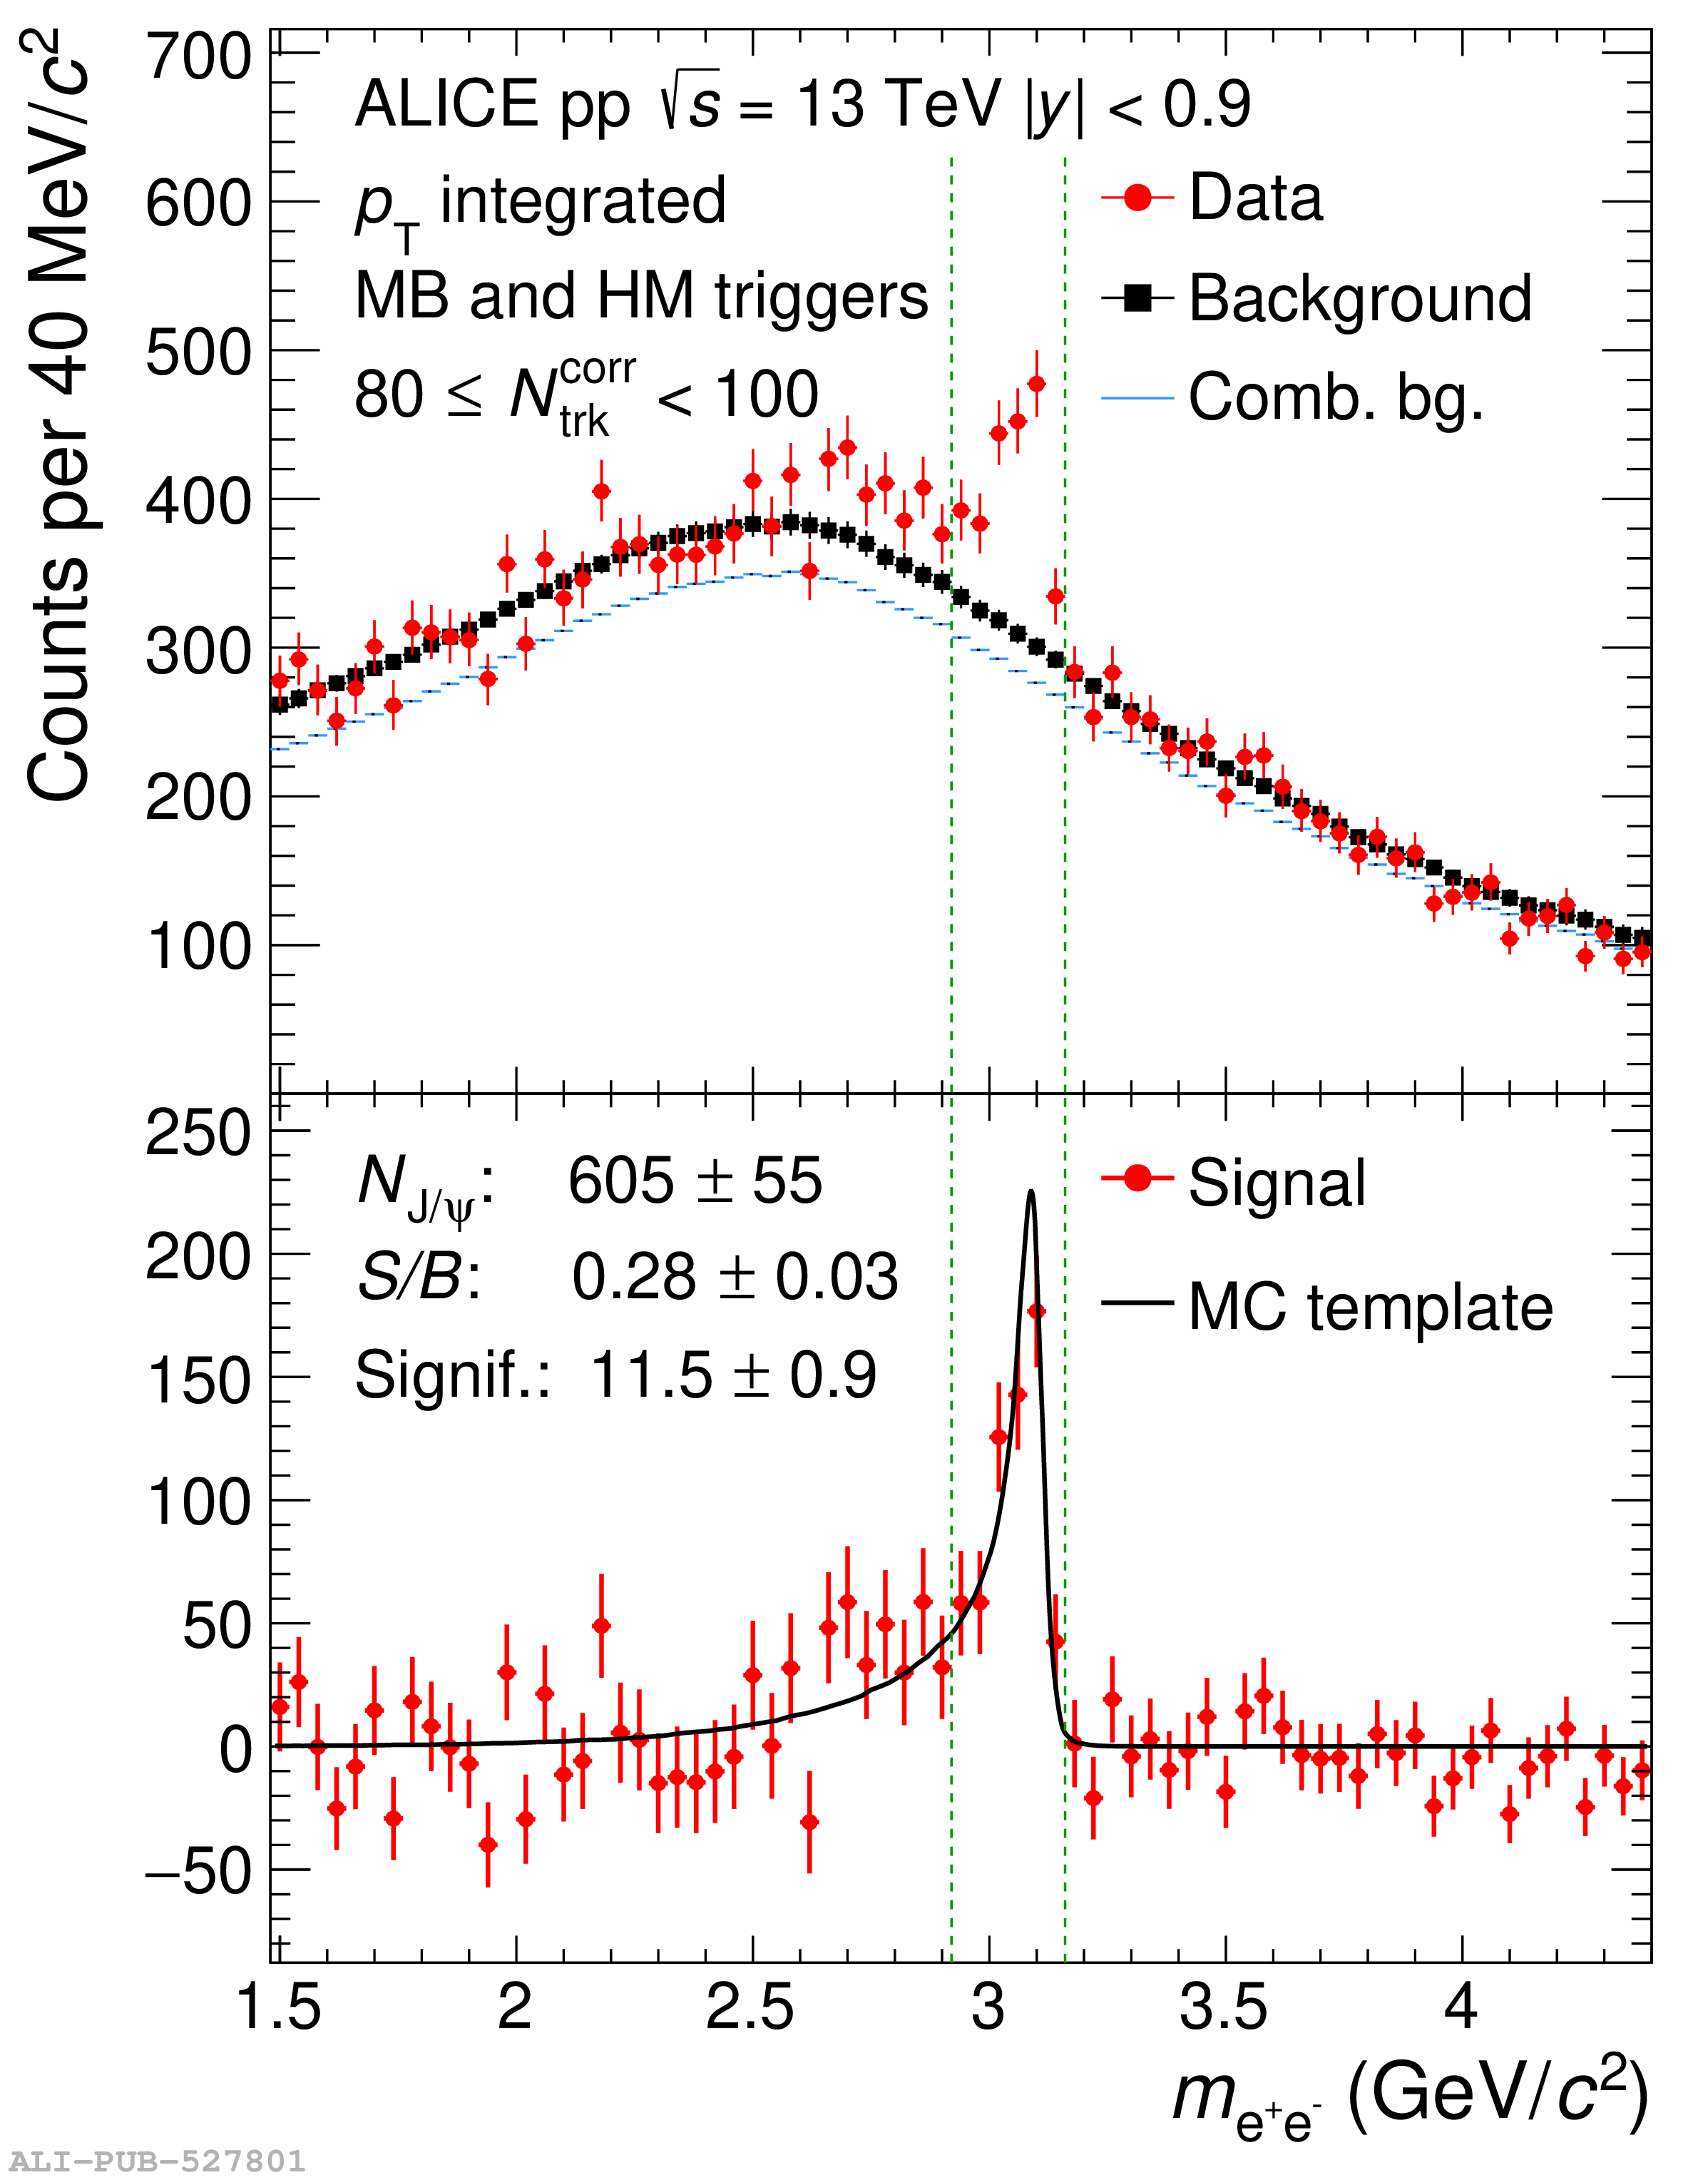  |
Figure 4
Normalized inclusive \pt-integrated \jpsi yield at midrapidity as a function of normalized charged-particle pseudorapidity density at midrapidity ($|\eta|<1$) with the event selection based on SPD tracklets at midrapidity and on V0 amplitude at forward rapidity in pp collisions at \sqrts{13}. Top: normalized \jpsi yield (diagonal drawn for reference). Bottom: double ratio of the normalized \jpsi yield and multiplicity. The error bars show statistical uncertainties and the boxes systematic uncertainties. | 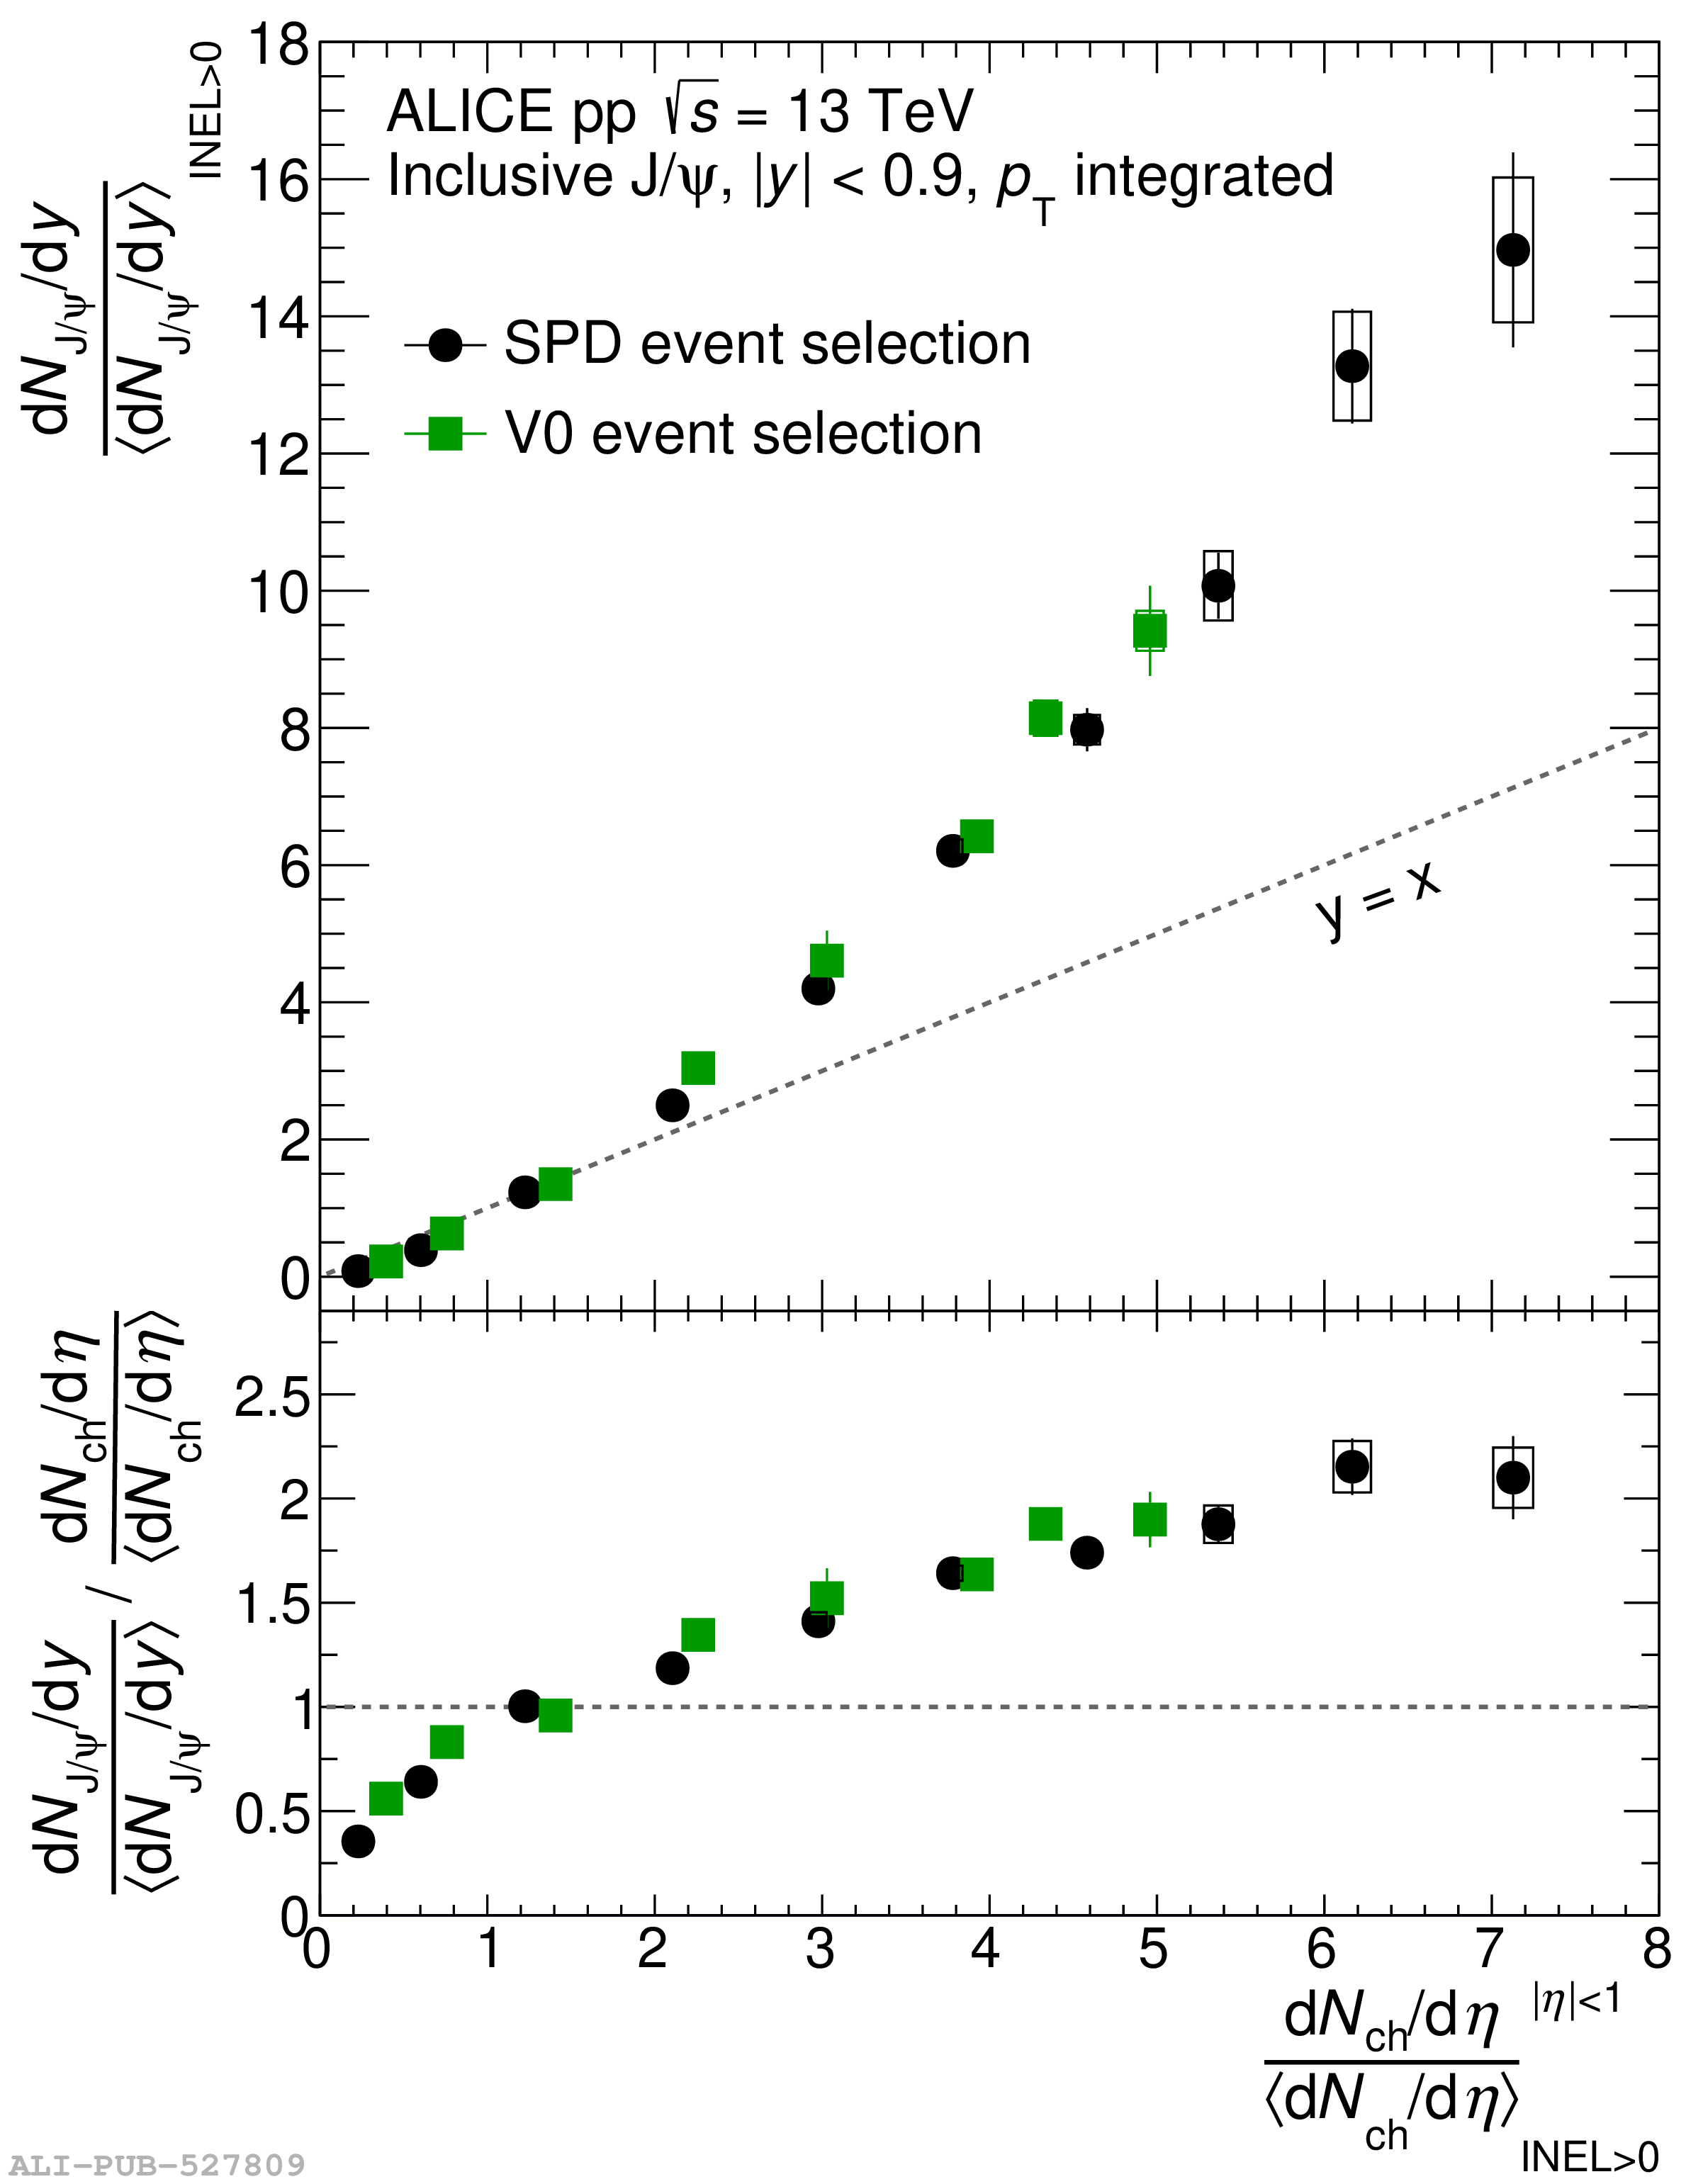 |
Figure 5
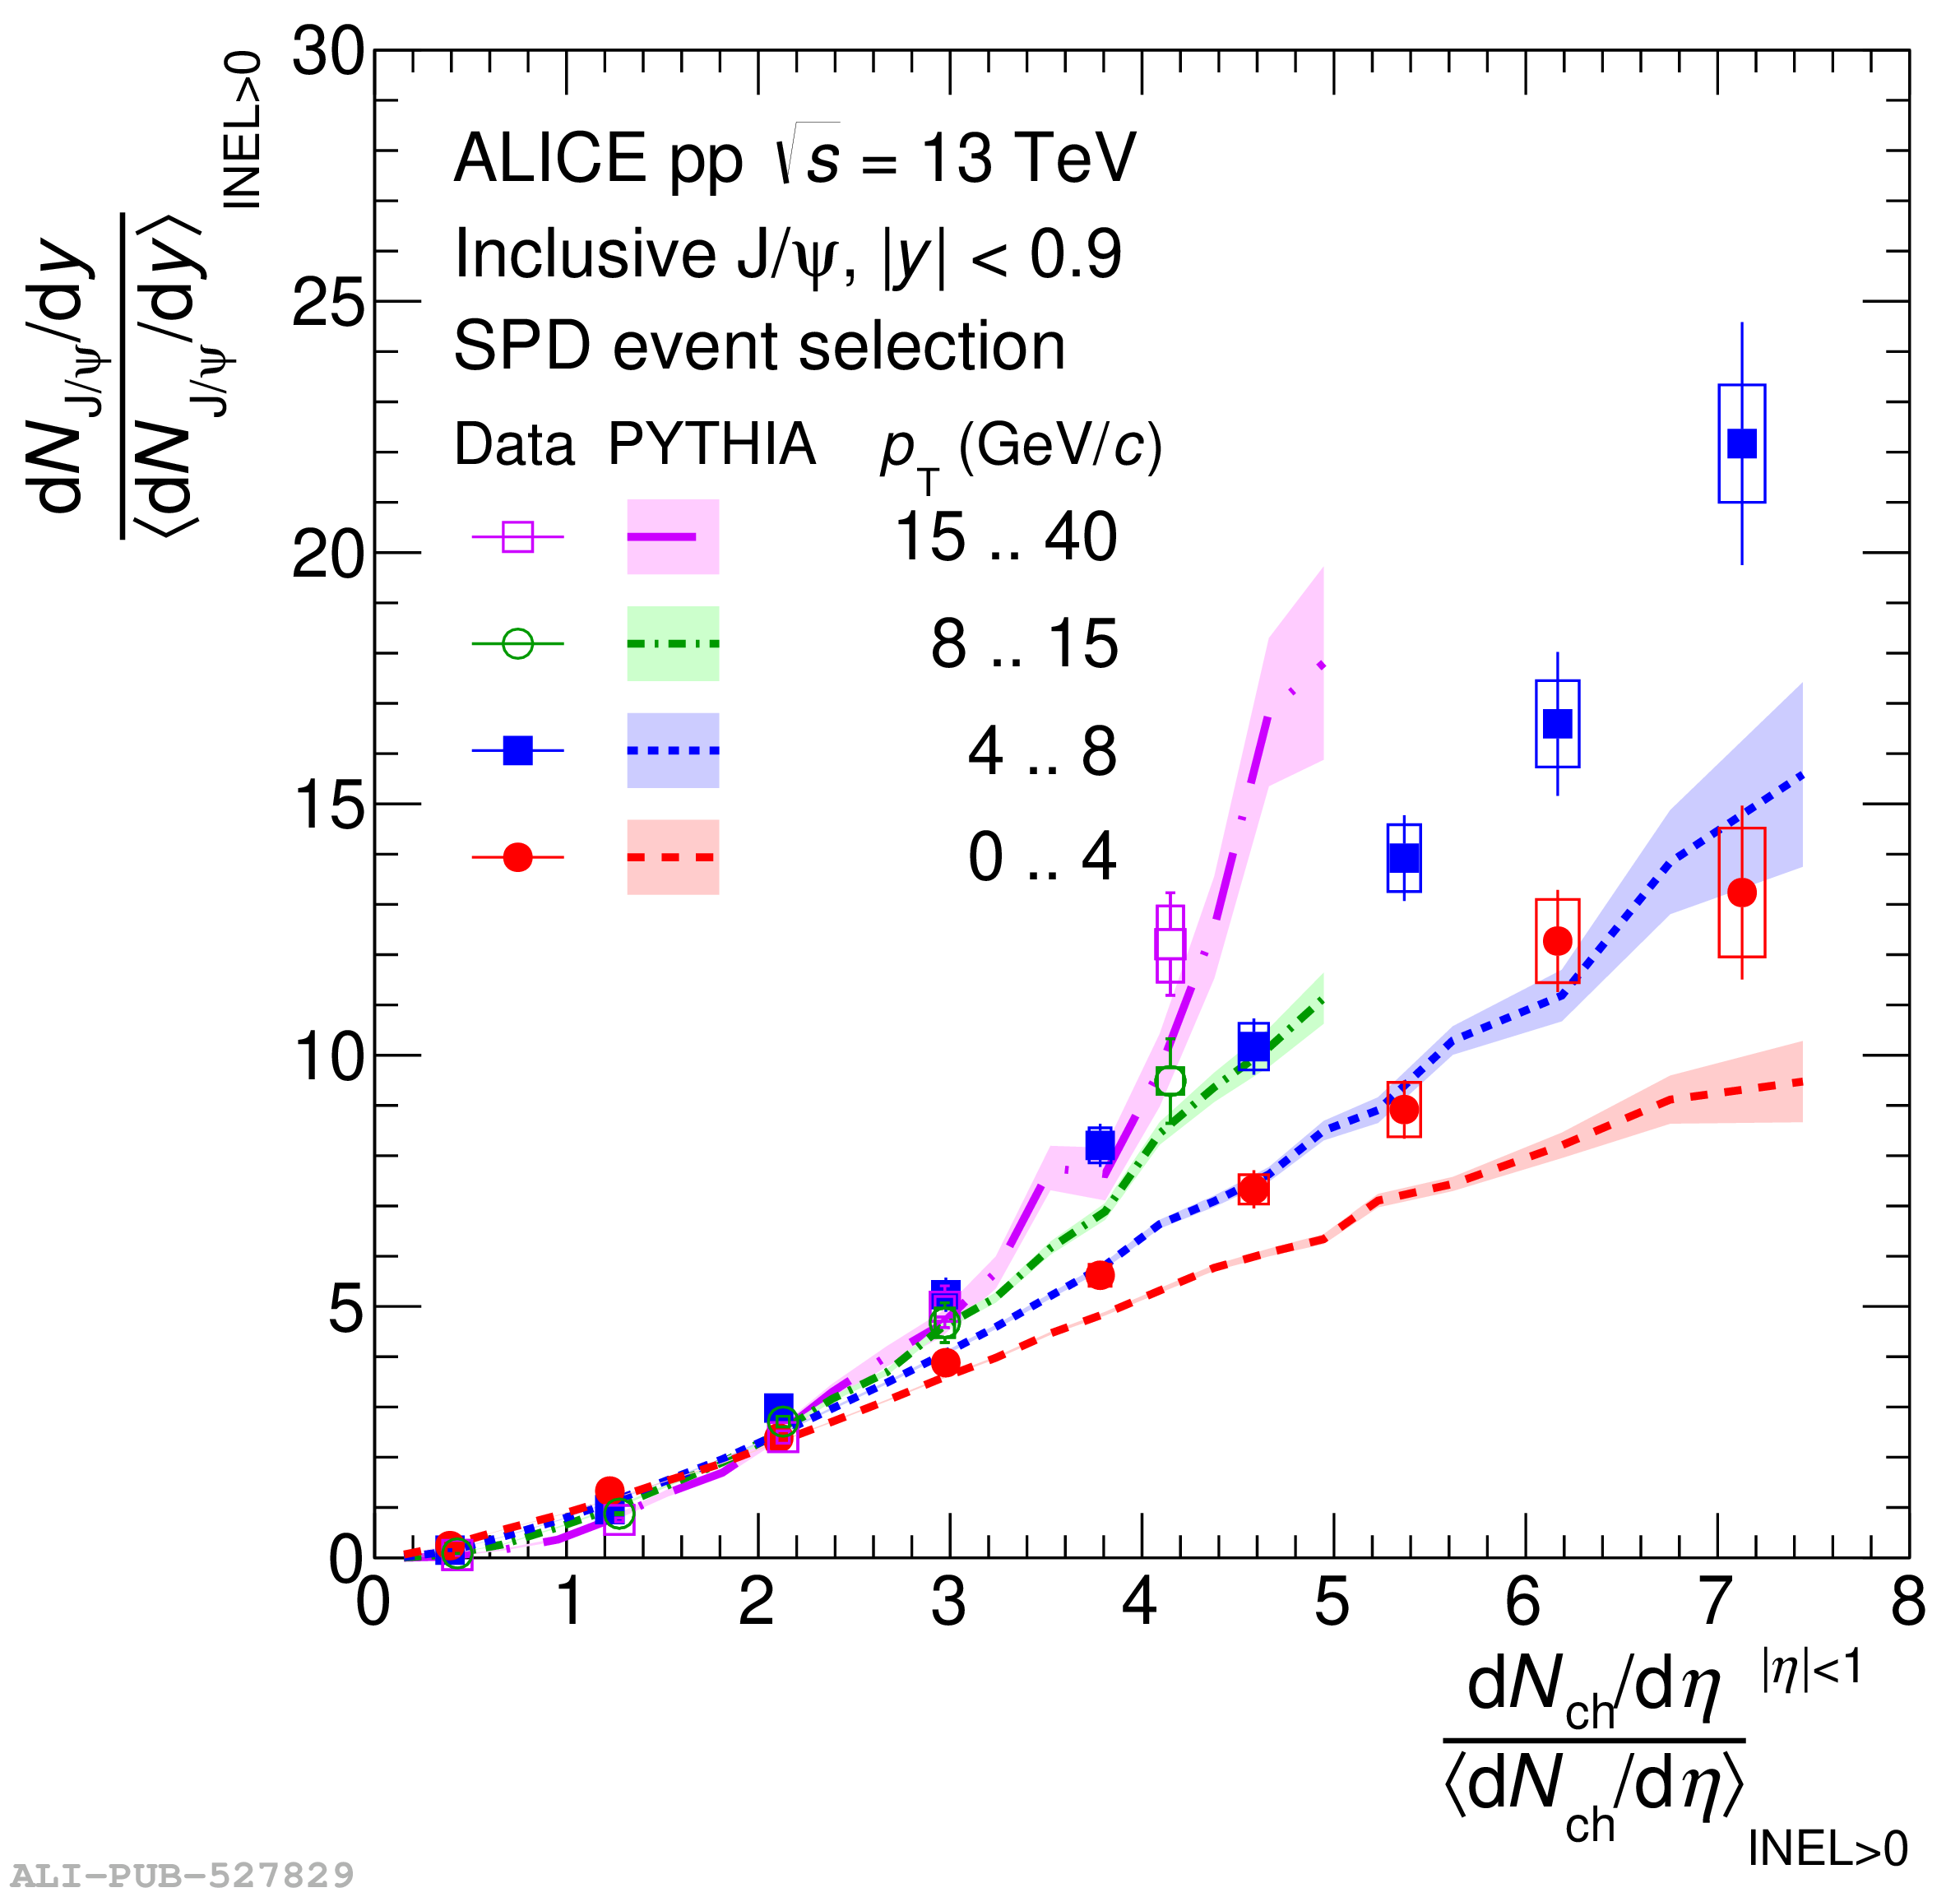
Normalized inclusive \jpsi yield at midrapidity as a function of normalized \mult in pp collisions at \sqrts{13}, for different ranges of \pt of the \jpsi meson. Left: event selection based on multiplicity at midrapidity. Right: event selection based on multiplicity at forward rapidity. The error bars show statistical uncertainties and the boxes systematic uncertainties. | 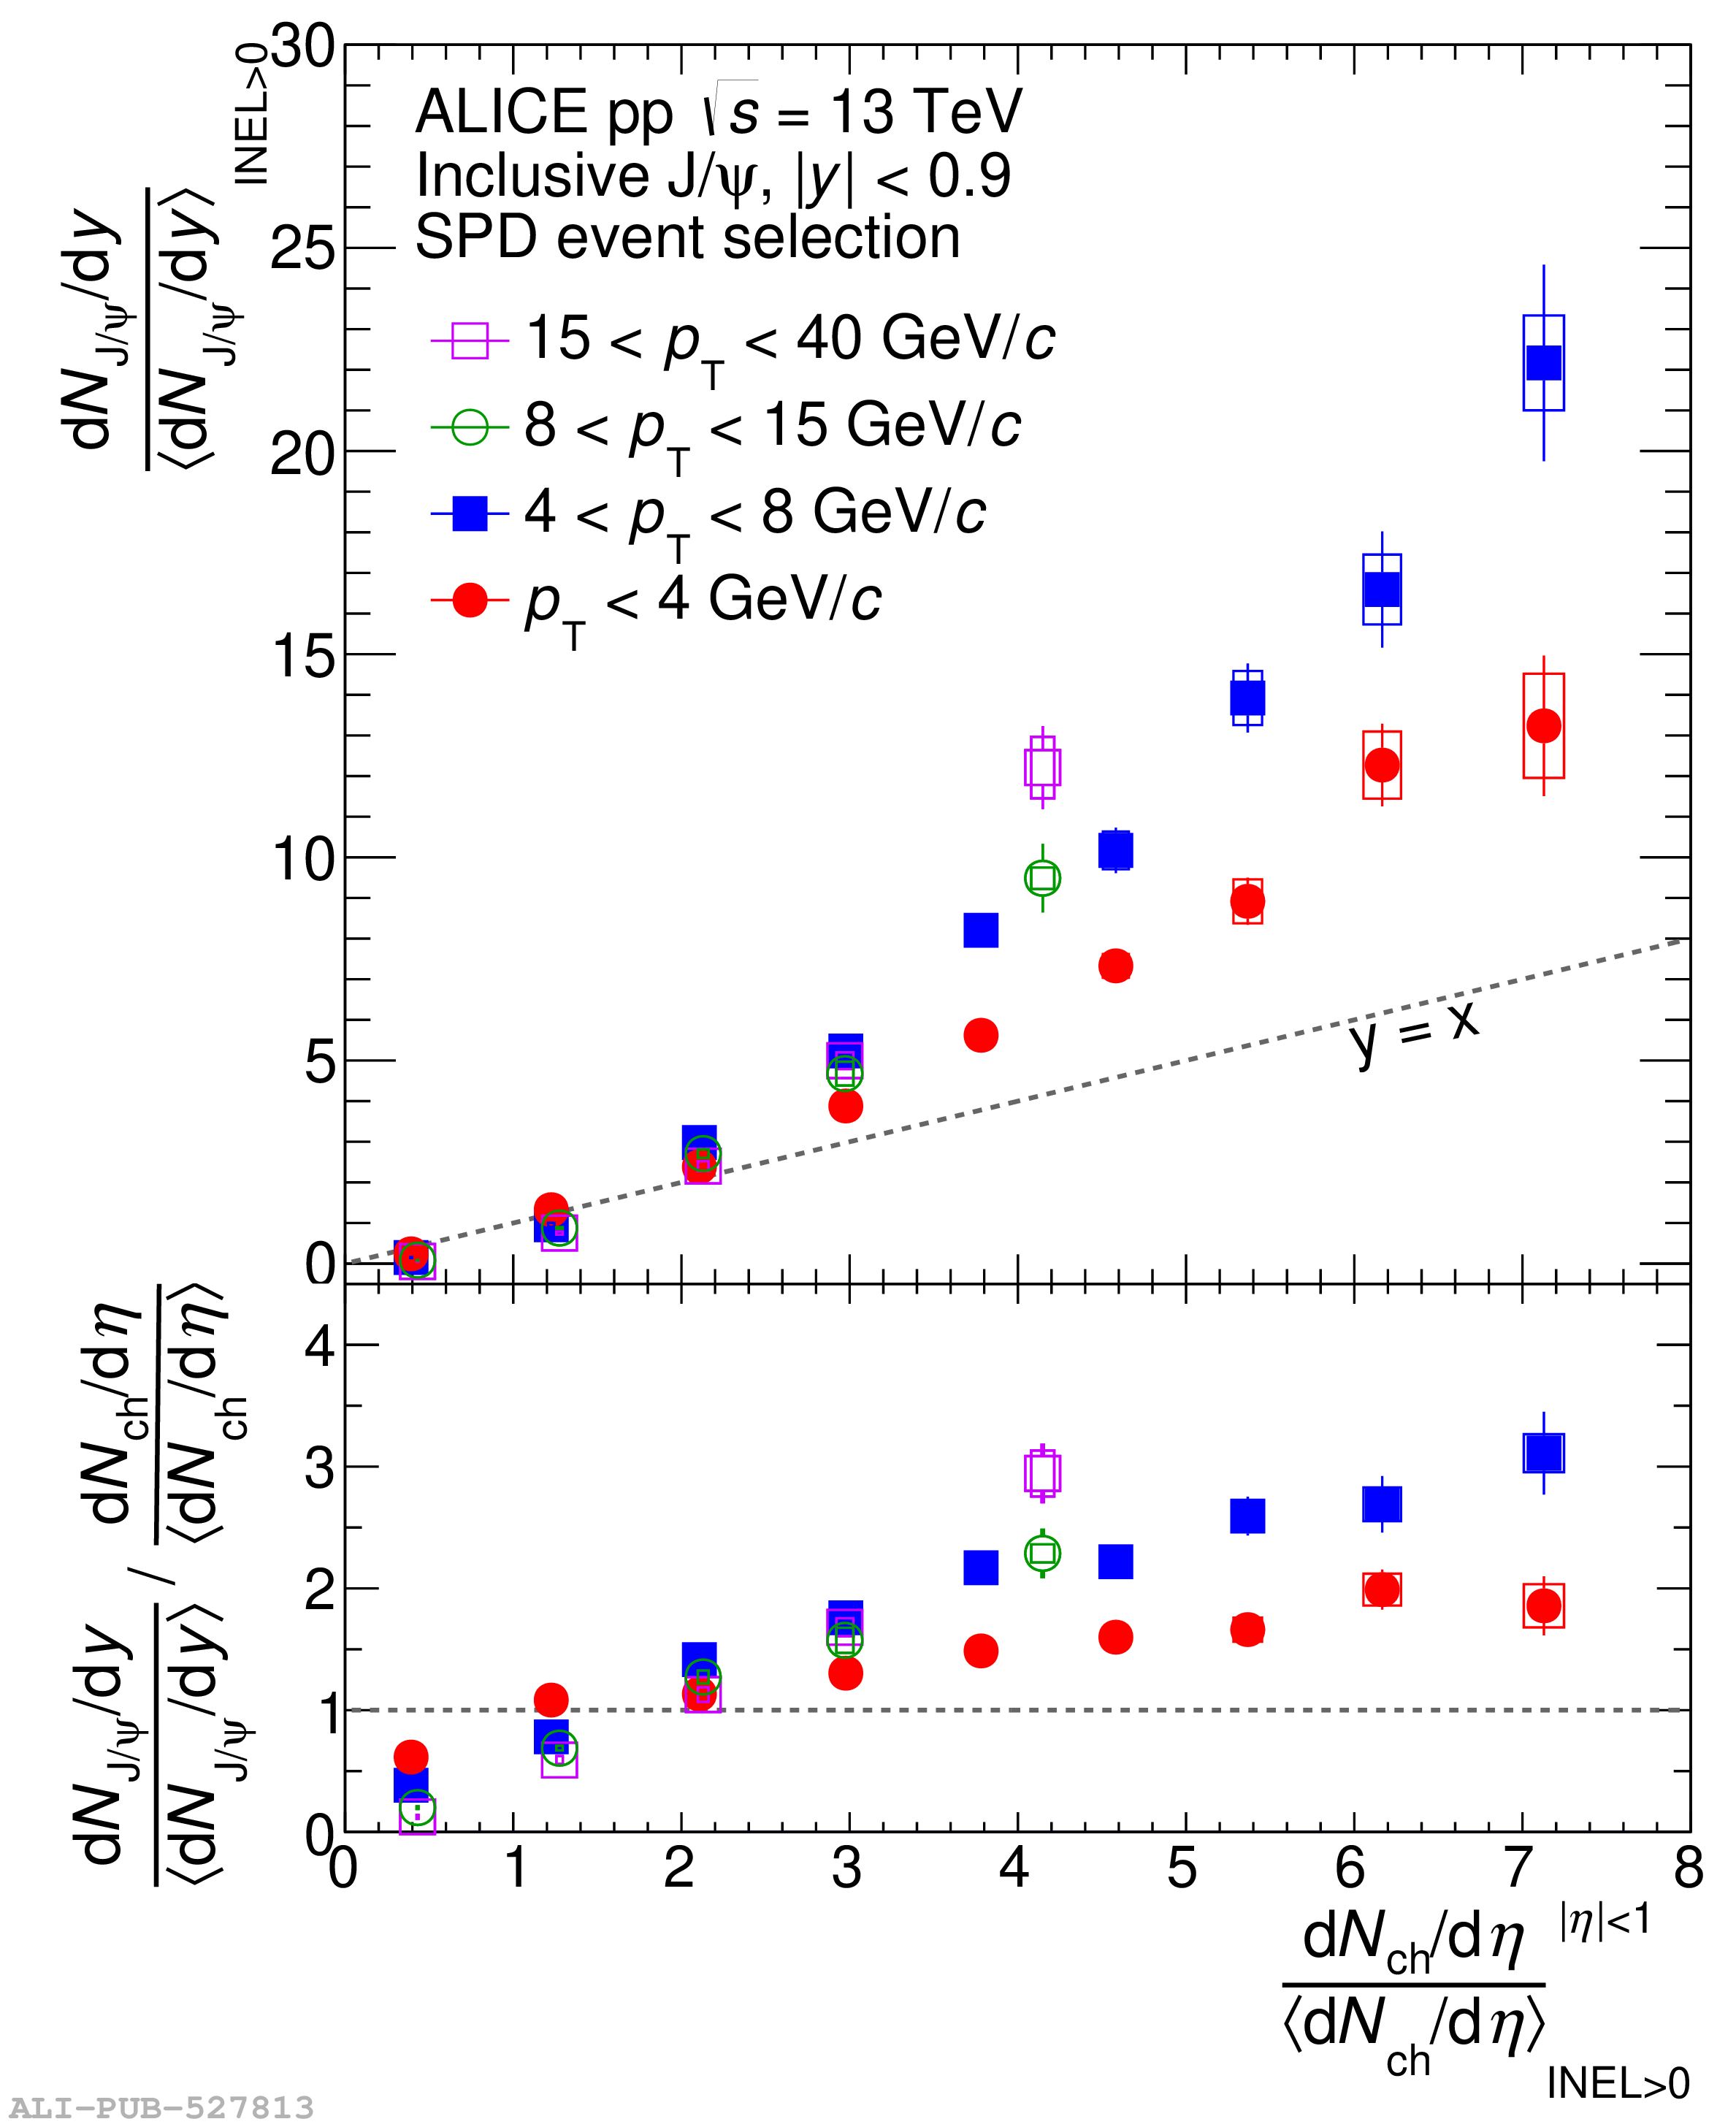  |
Figure 6
Left: Comparison of data and PYTHIA 8.2 predictions for the two methods of event selection. For PYTHIA 8.2, the case of prompt J/$\psi$ meson production is included for illustration. Right: comparison of data (with SPD event selection) with model predictions from the coherent particle production model , the percolation model , the EPOS3 event generator , the CGC model , the 3-Pomeron CGC model , and PYTHIA 8.2 predictions. Except for the latter, none of the models include the non-prompt component. | 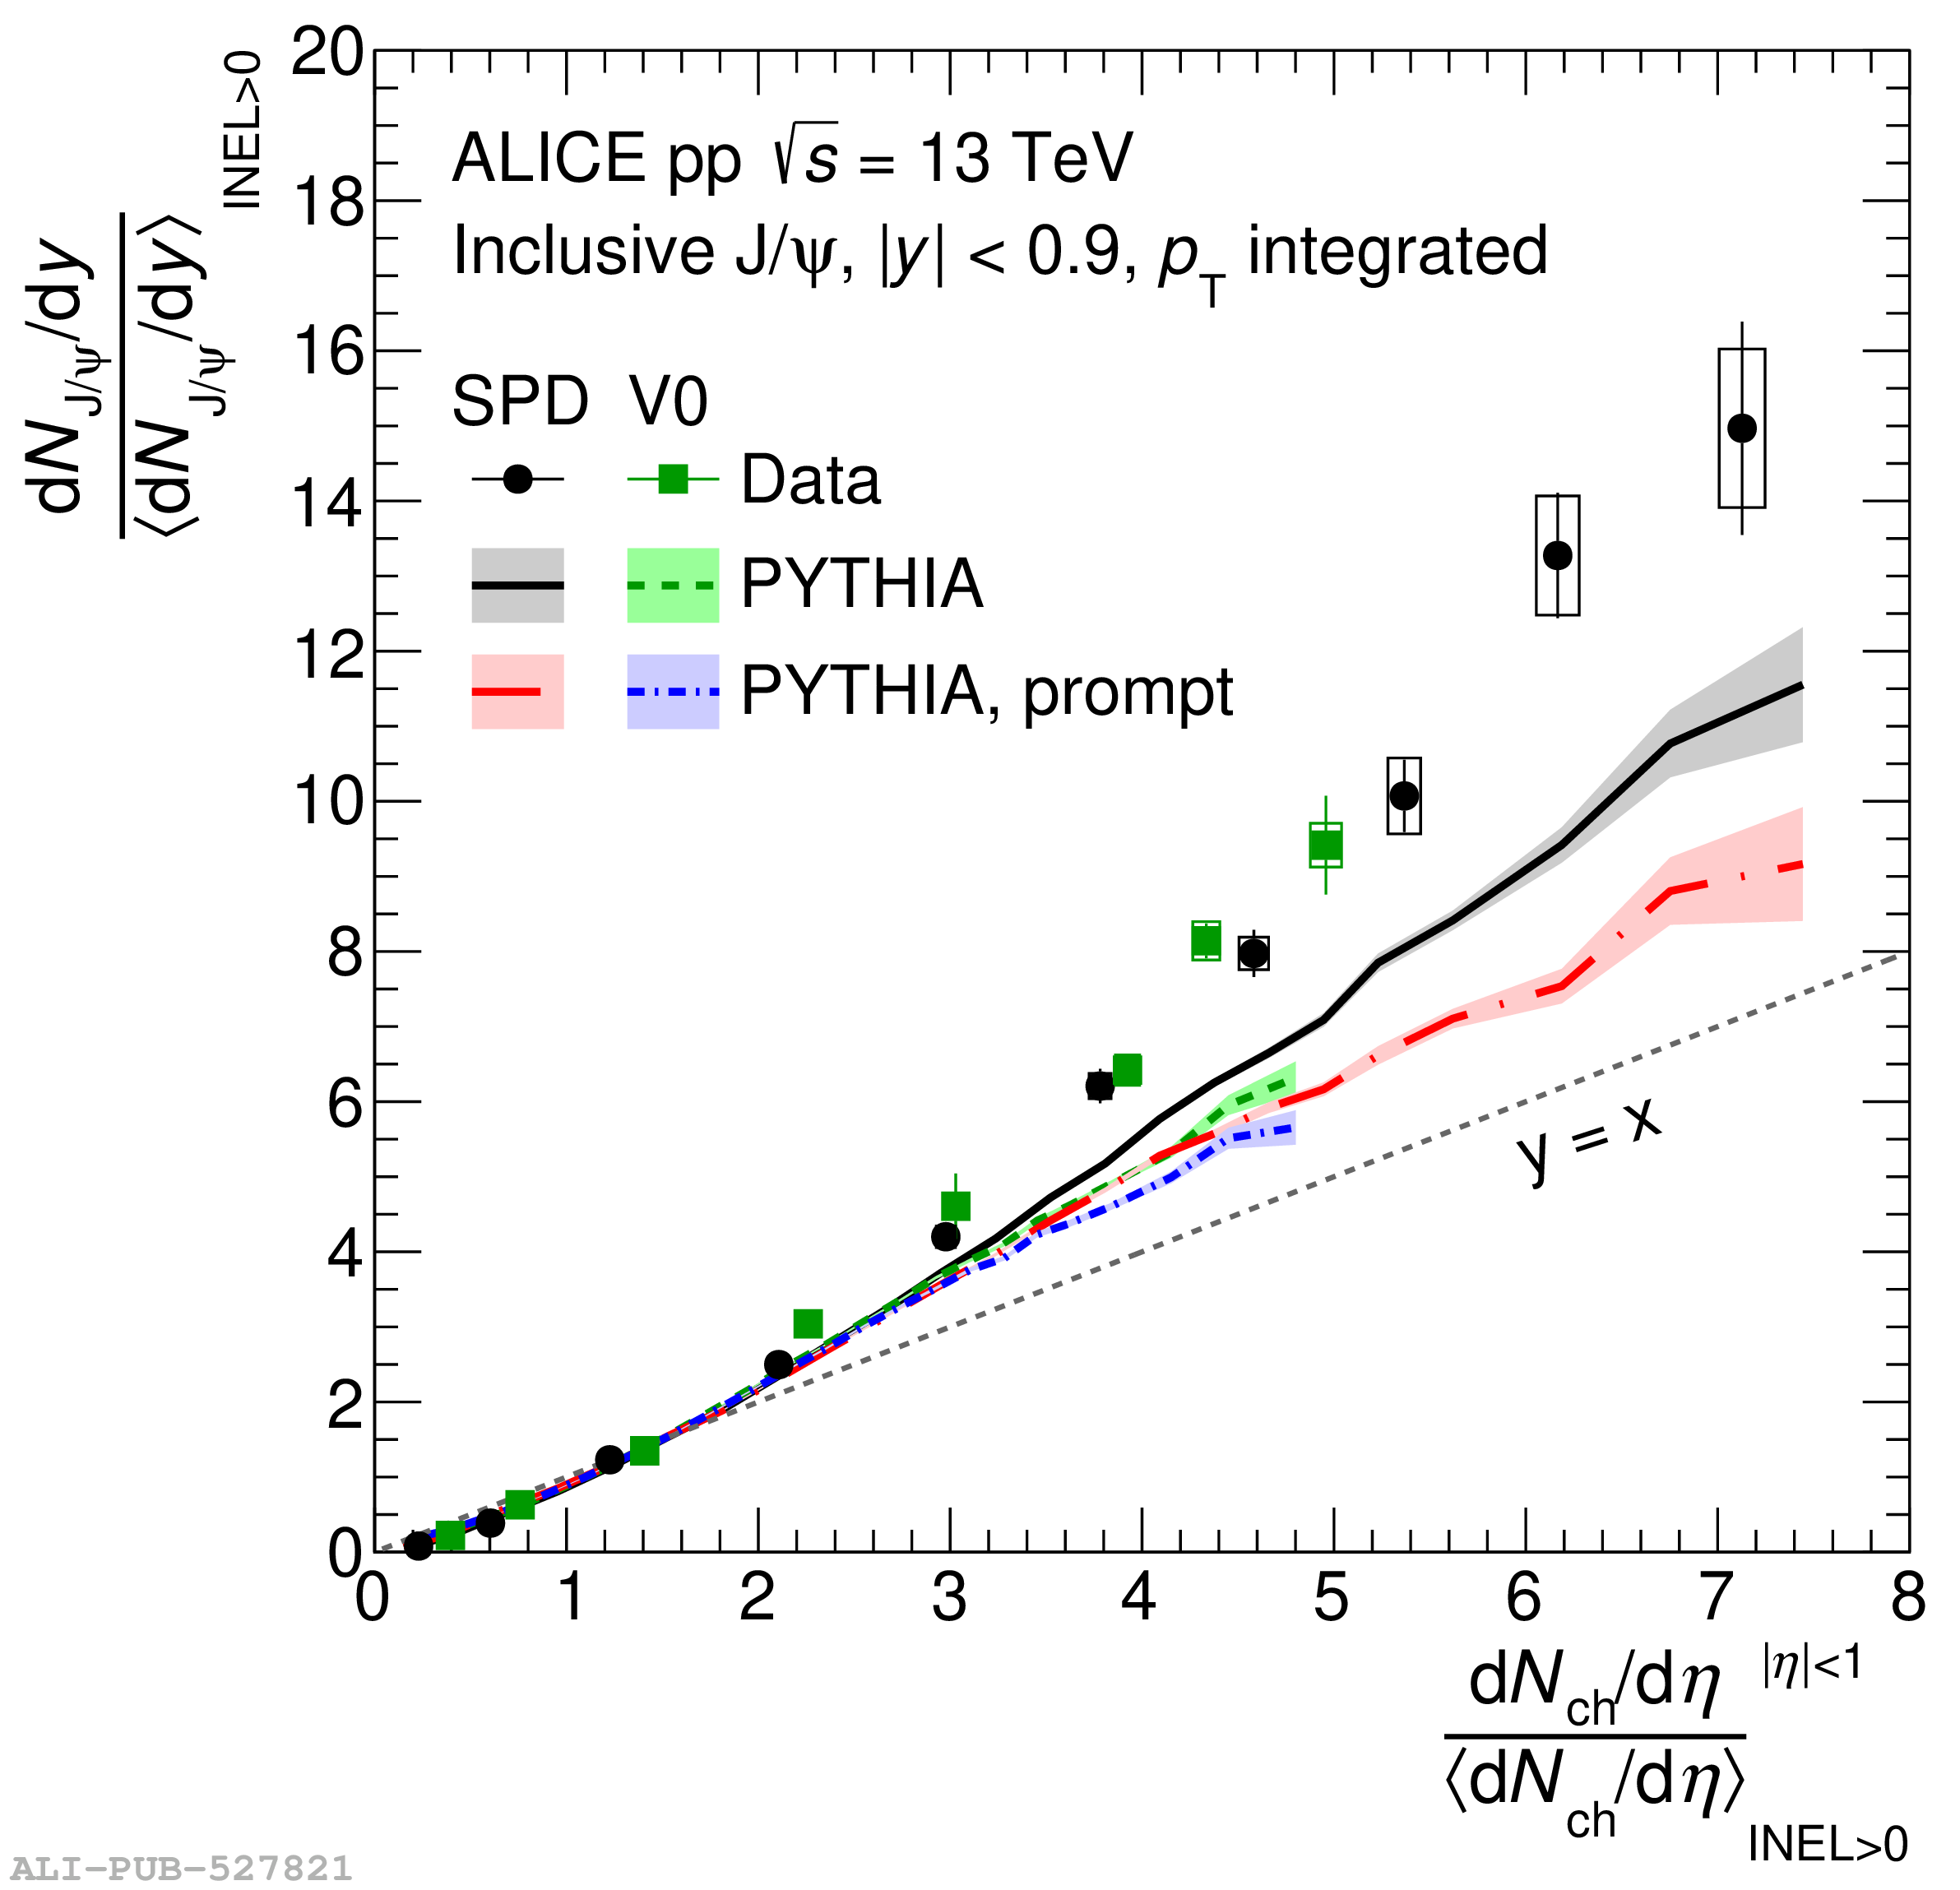 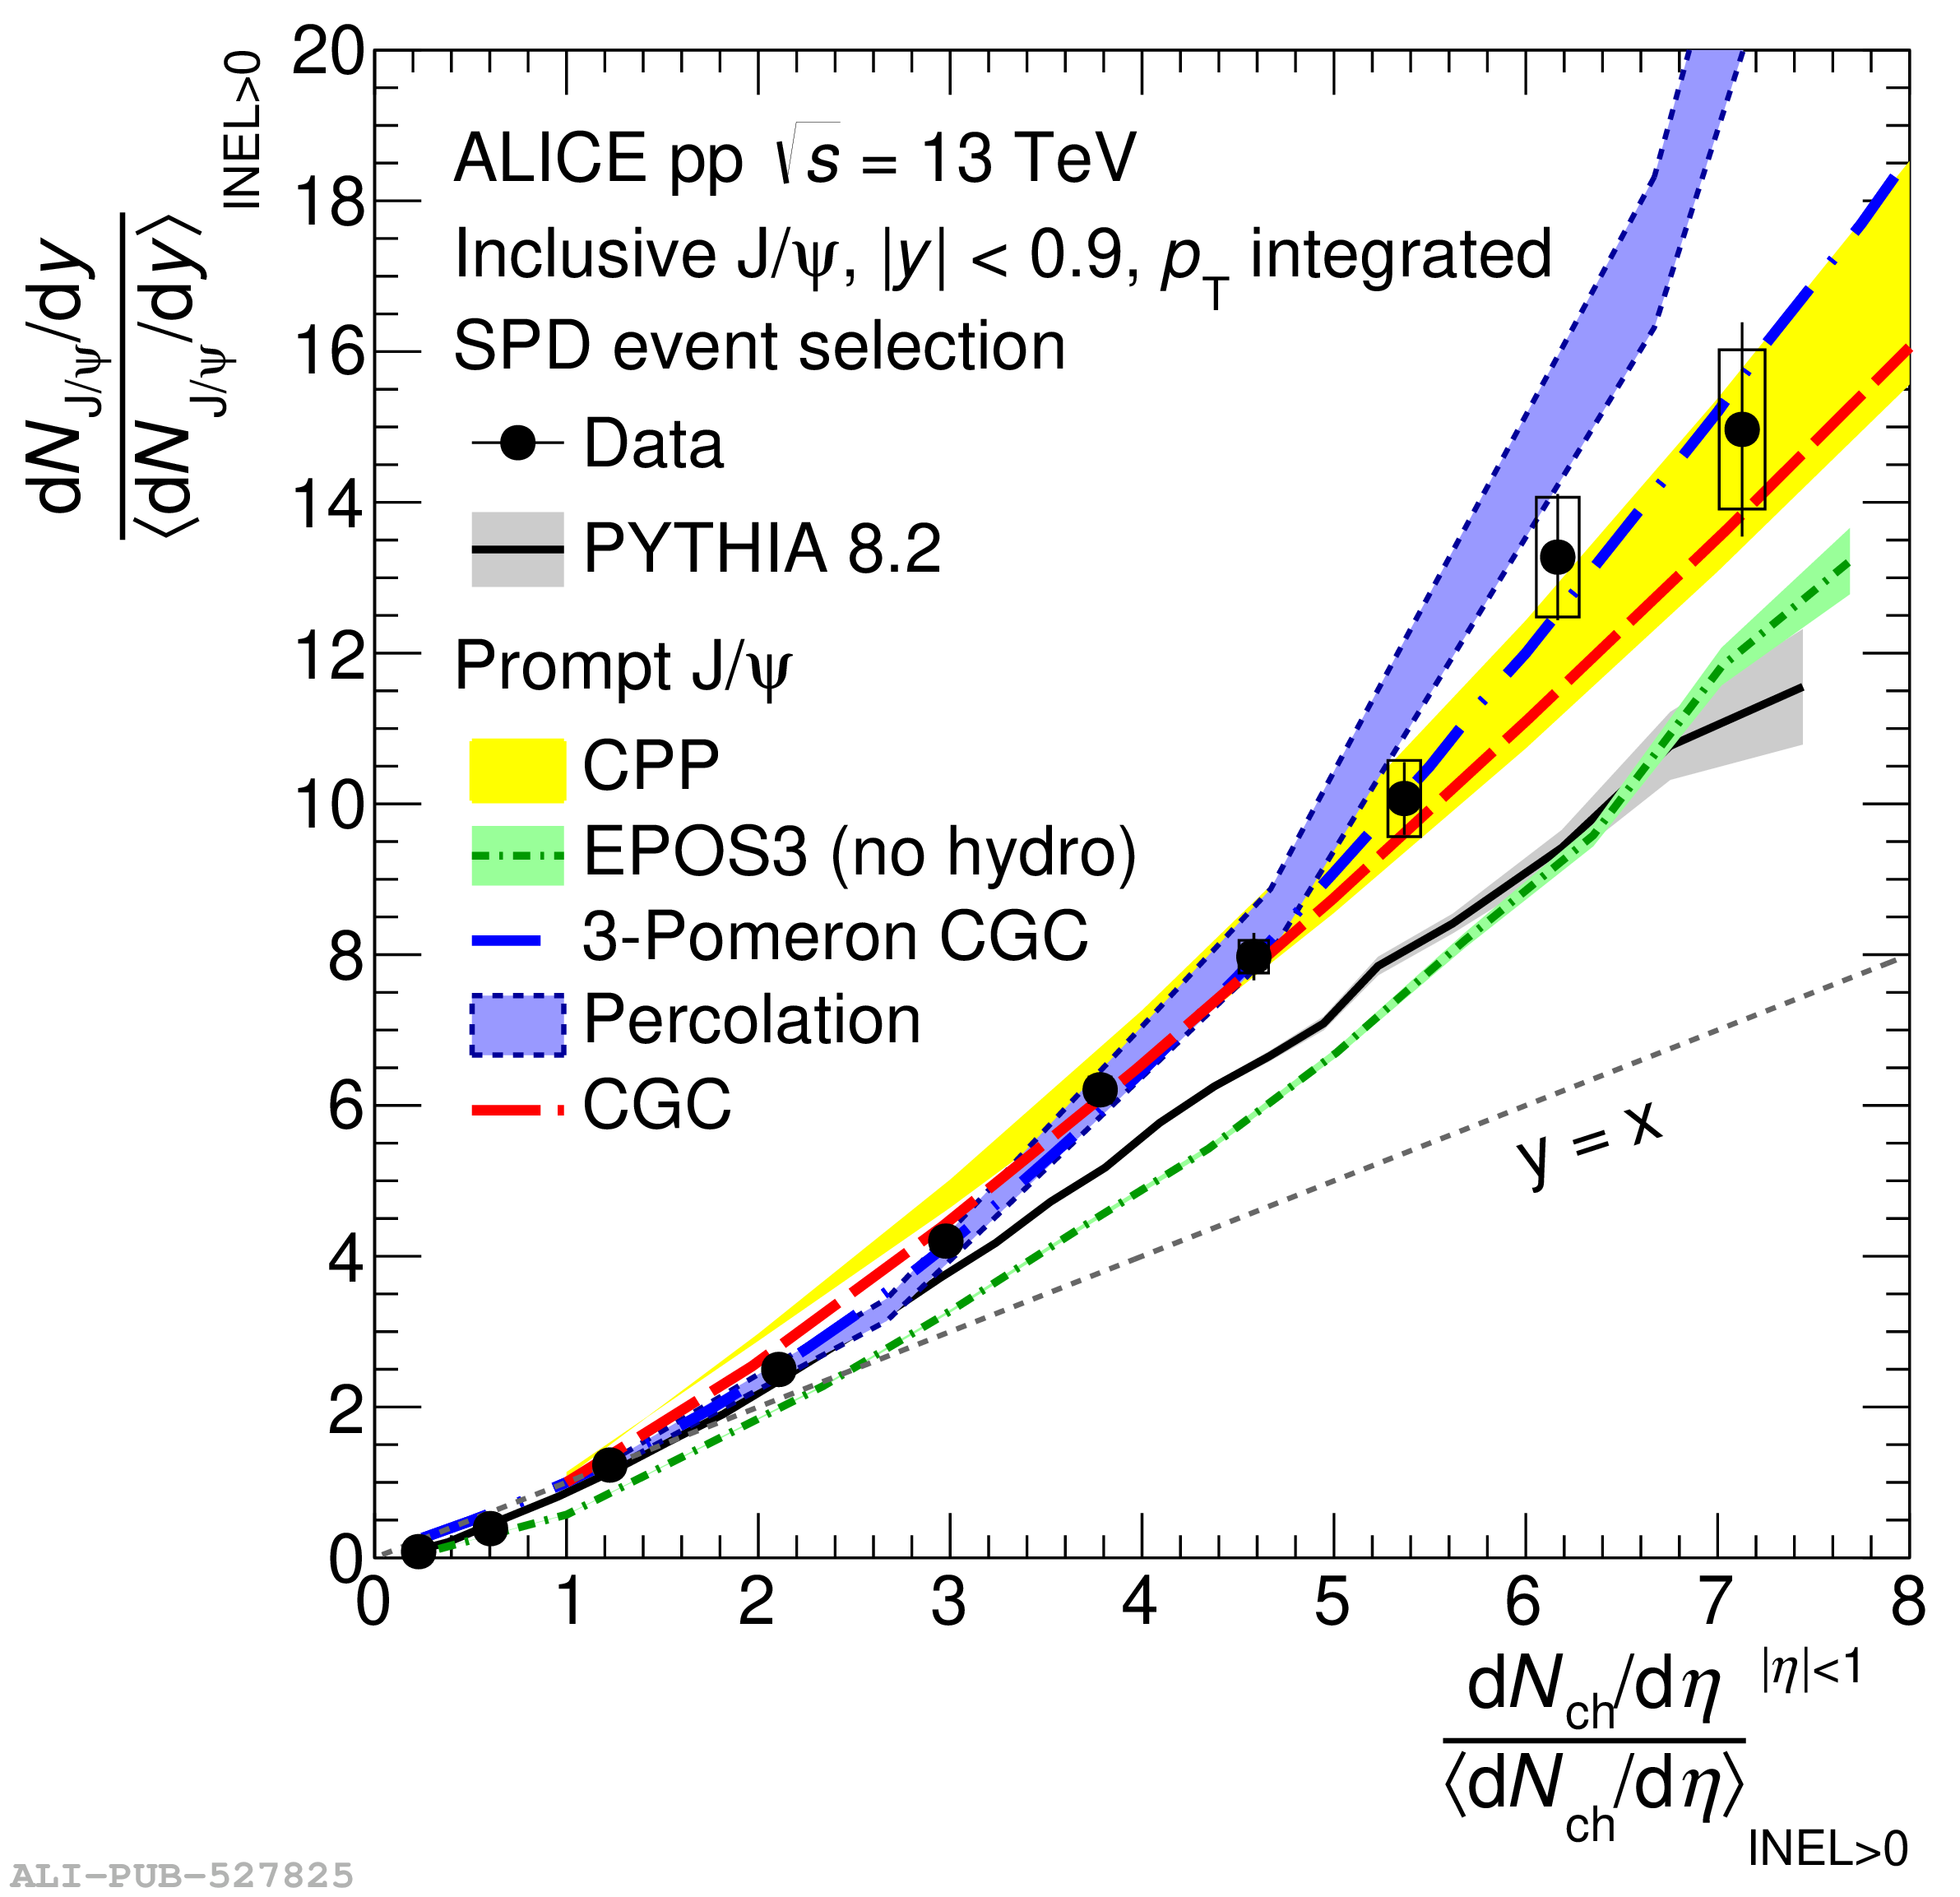 |