Performance of the PID detectors:
(a) ${\rm d}E/{\rm d}x$ distribution measured in the ITS, the continuous curves represent the Bethe-Bloch parametrization, the dashed curves the asymmetric bands used in the PID procedure; (b) ${\rm d}E/{\rm d}x$ measured in the TPC with global tracks (see text for the definition of global tracks), the continuous curves represent the Bethe-Bloch parametrization; (c) fit of the TOF time distribution with the expected contributions for negative tracks and for the kaon mass hypothesis, in the bin $2.4 < \pt < 2.5$ GeV/$c$. | 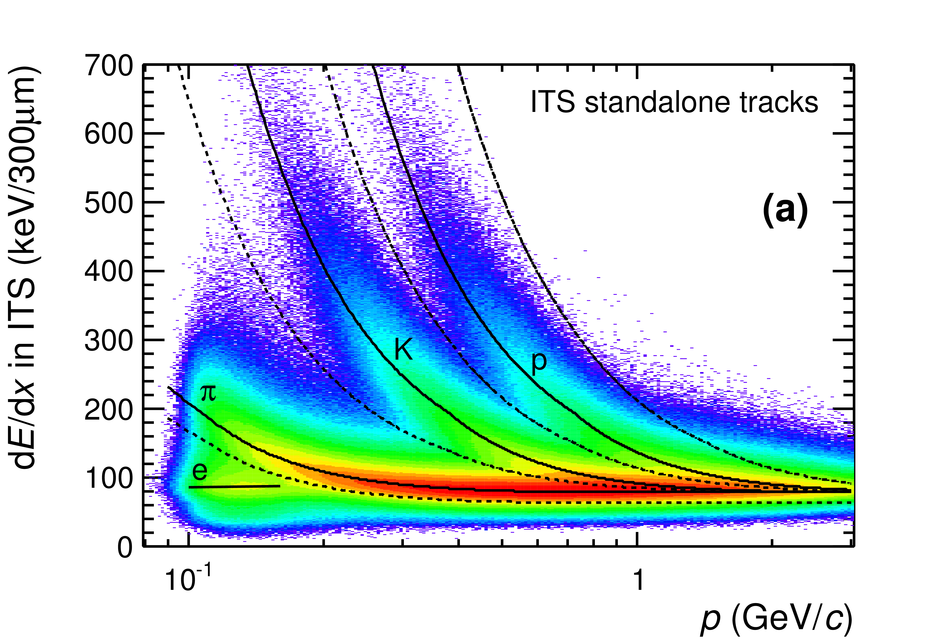 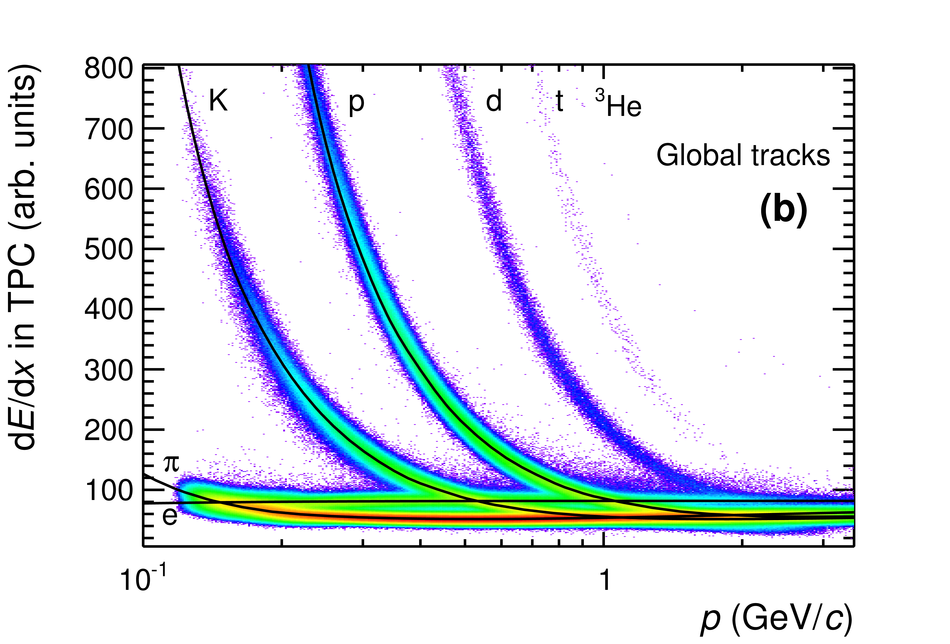 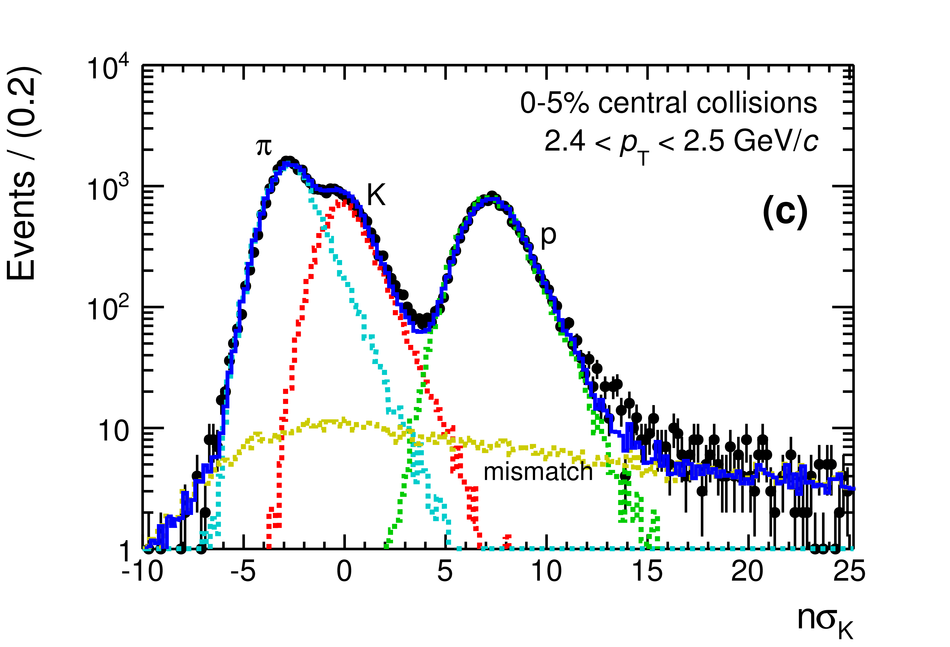 |