Multiplicity dependence of $π$, K, and p production in pp collisions at $\sqrt{s} = 13$ TeV

This paper presents the measurements of $\pi^{\pm}$, $\rm{K}^{\pm}$, $\rm{p}$ and $\bar{\rm{p}}$ transverse momentum ($p_{\rm{T}}$) spectra as a function of charged-particle multiplicity density in proton-proton (pp) collisions at $\sqrt{s}$ = 13 TeV with the ALICE detector at the LHC. Such study allows us to isolate the center-of-mass energy dependence of light-flavour particle production. The measurements reported here cover a $p_{\rm{T}}$ range from 0.1 GeV/$c$ to 20 GeV/$c$ and are done in the rapidity interval $|y|<~0.5$. The $p_{\rm{T}}$-differential particle ratios exhibit an evolution with multiplicity, similar to that observed in pp collisions at $\sqrt{s}$ = 7 TeV, which is qualitatively described by some of the hydrodynamical and pQCD-inspired models discussed in this paper. Furthermore, the $p_{\rm{T}}$-integrated hadron-to-pion yield ratios measured in pp collisions at two different center-of-mass energies are consistent when compared at similar multiplicities. This also extends to strange and multistrange hadrons, suggesting that, at LHC energies, particle hadrochemistry scales with particle multiplicity the same way under different collision energies and colliding systems.


Eur. Phys. J. C 80 (2020) 693
HEP Data
e-Print: arXiv:2003.02394 | PDF | inSPIRE
CERN-EP-2020-024

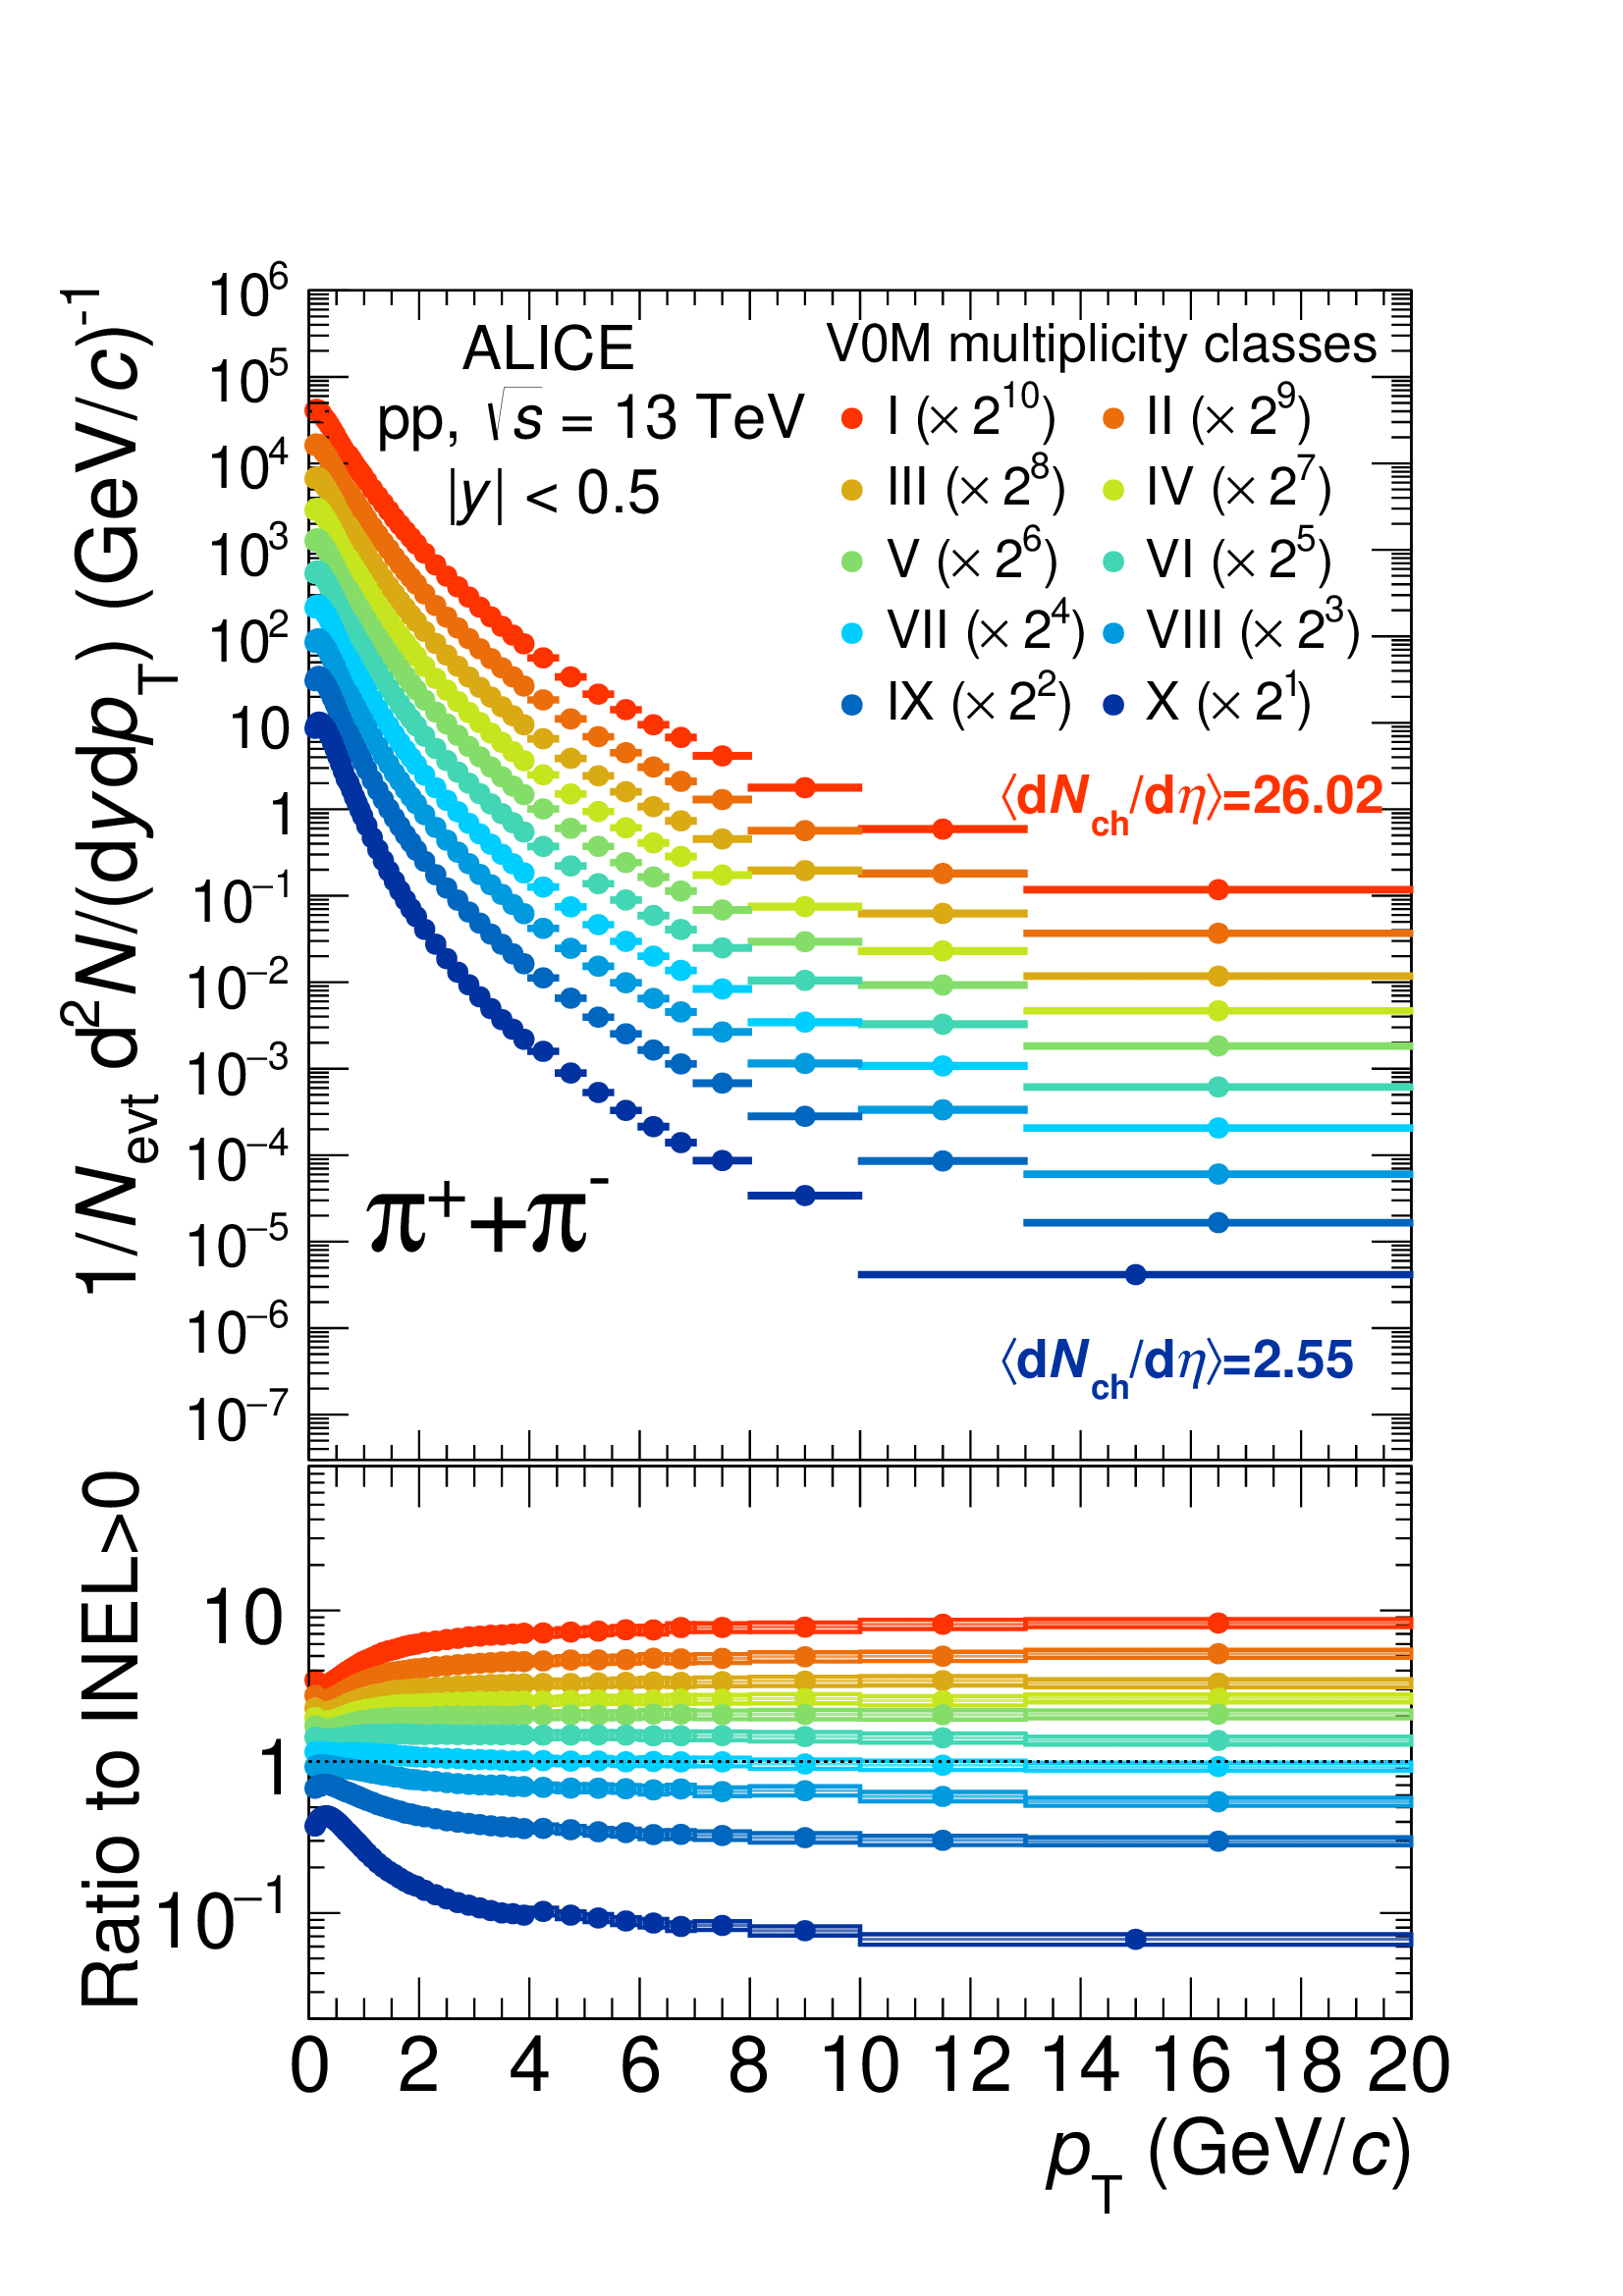
Figure 1

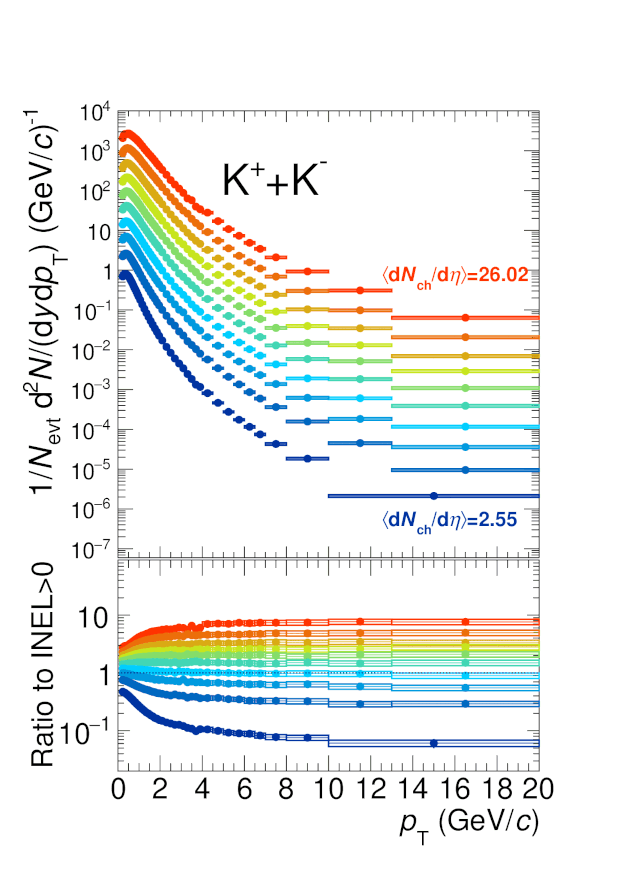
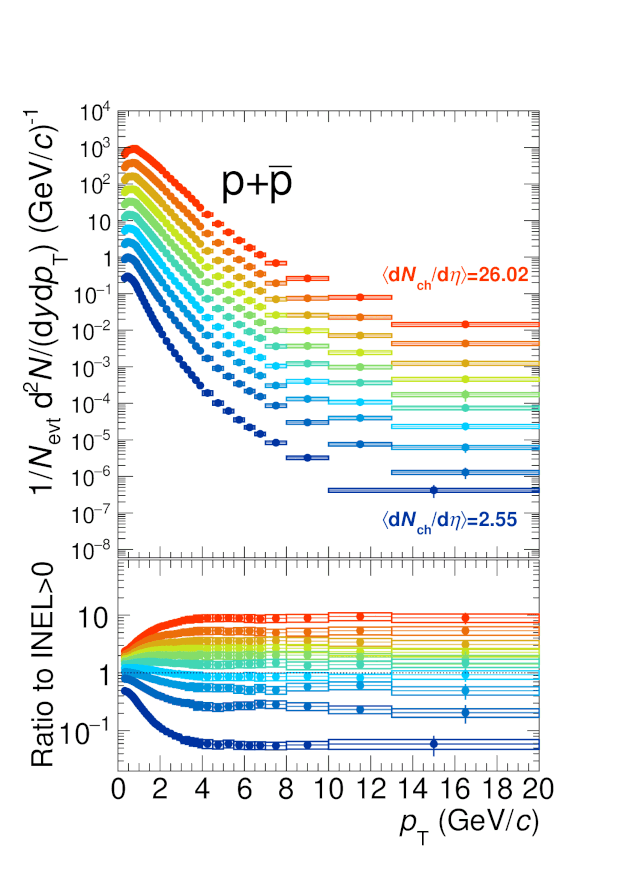
Transverse momentum spectra of \pion, \kaon, and \pr for different multiplicity event classes. Spectra are scaled by powers of 2 in order to improve visibility. The corresponding ratios to INEL$>$0 spectra are shown in the bottom panels.

Figure 2

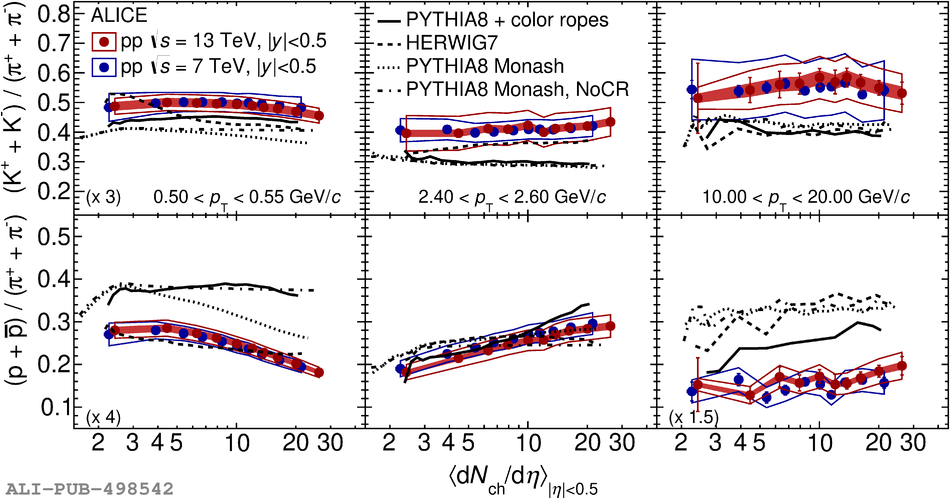
Multiplicity dependence of \pT-differential \kaon/\pion (upper panels) and \pr/\pion (lower panels) ratios measured in pp collisions at $\sqrt{s}$ = 7 TeV and 13 TeV (blue and red, respectively) Lines represent different MC generator predictions for pp collisions at \cme{13}. Left to right: low-, intermediate-, and high-transverse momenta. Vertical bars, open, and shaded bands represent statistical, total systematic, and multiplicity uncorrelated systematic uncertainties, respectively. Numbers in the parenthesis in different panels represent different scale factors for data and MC predictions for better readability.

Figure 3

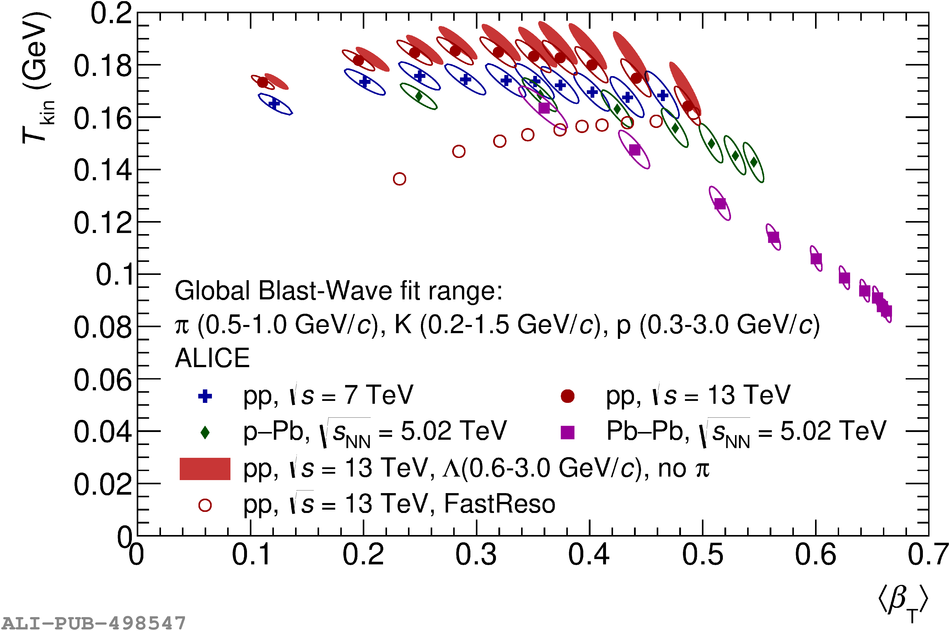
Correlation of kinetic freeze-out temperature \Tkin and average expansion velocity \mbeta, extracted from simultaneous Blast-Wave fits to \pion, \kaon, and \pr spectra measured in pp, p--Pb, and Pb--Pb collisions. Contours represent 1$\sigma$ uncertainty. The shaded ellipses represent the \Tkin-\mbeta correlation calculated from Blast-Wave fit to \kaon, \pr, and $\Lambda$ spectra  measured in pp collisions at \cme{13}. The empty circles represent Blast-Wave fits with resonance decays . References from .

Figure 4

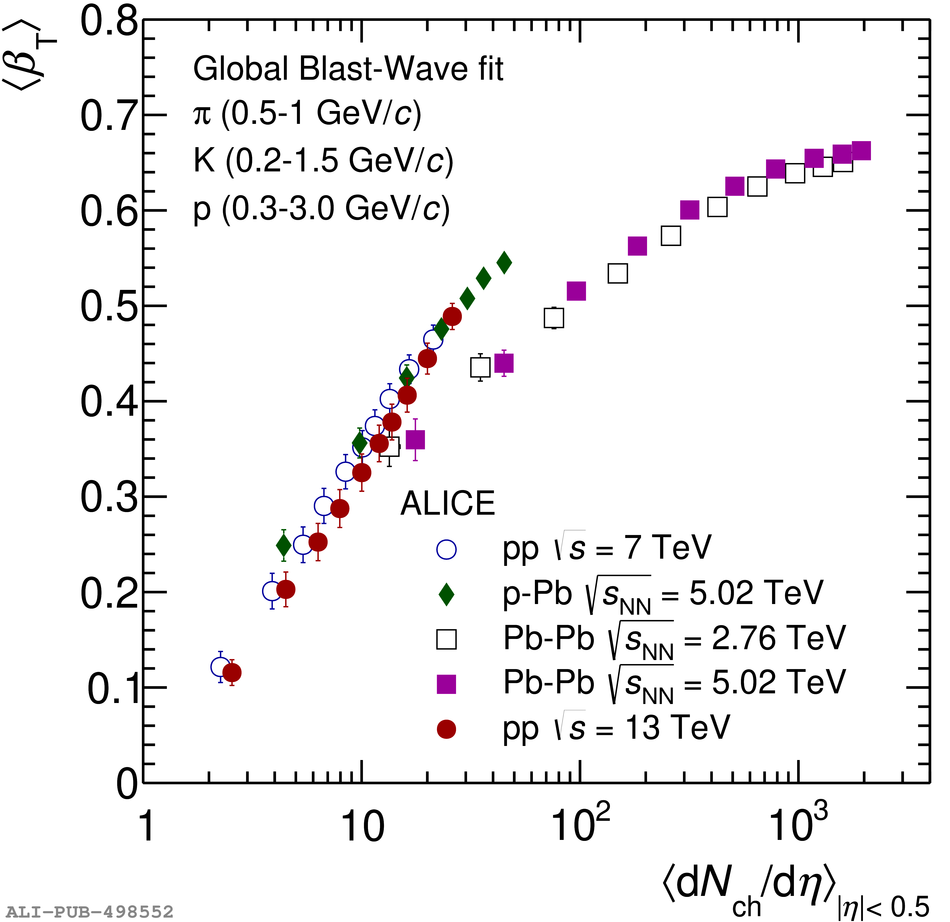
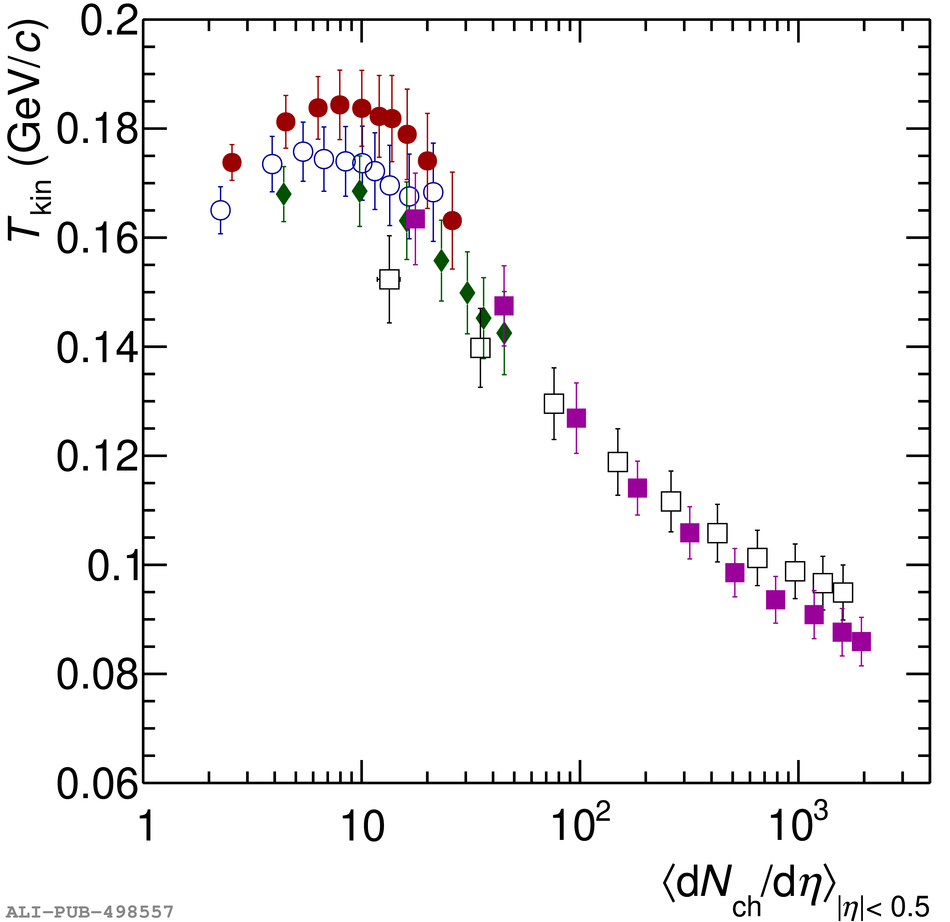
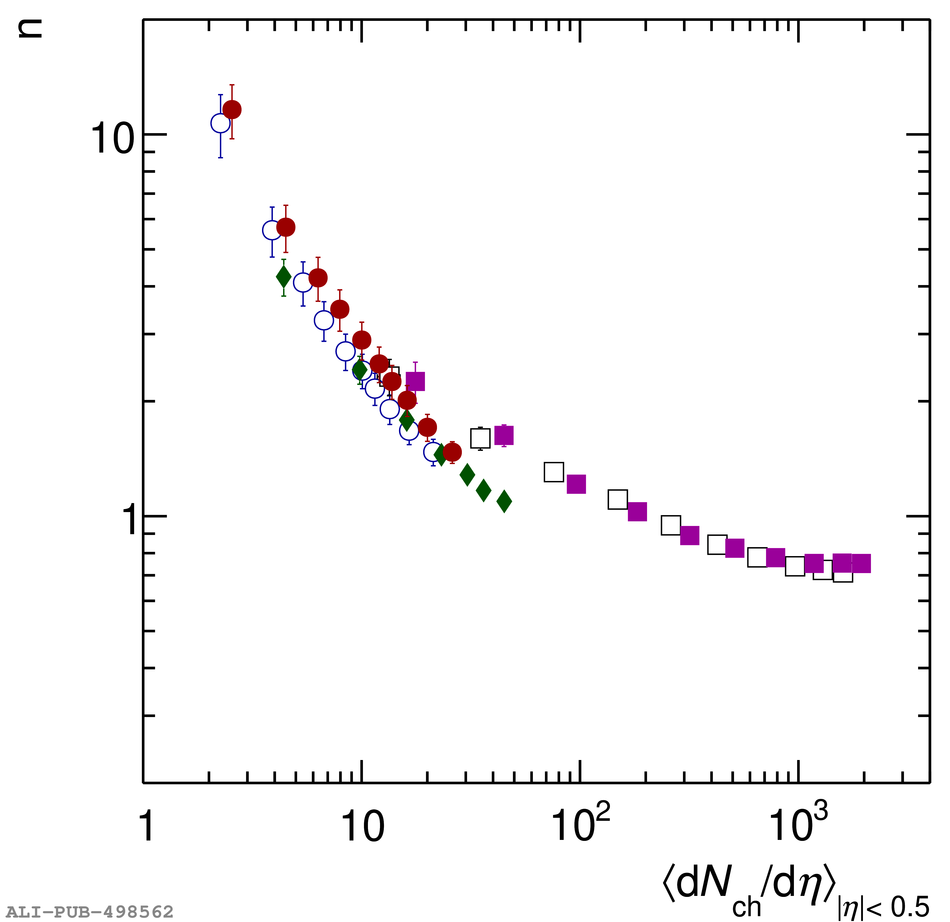
Evolution of \mbeta, \Tkin, and $n$ with \mdNde. \mbeta, \Tkin and $n$ are extracted from Blast-Wave fits to \pion, \kaon, and \pr \pT spectra measured in pp, p--Pb, and Pb--Pb collisions at different \cmes. The resonance feed-down contribution is neglected.

Figure 5

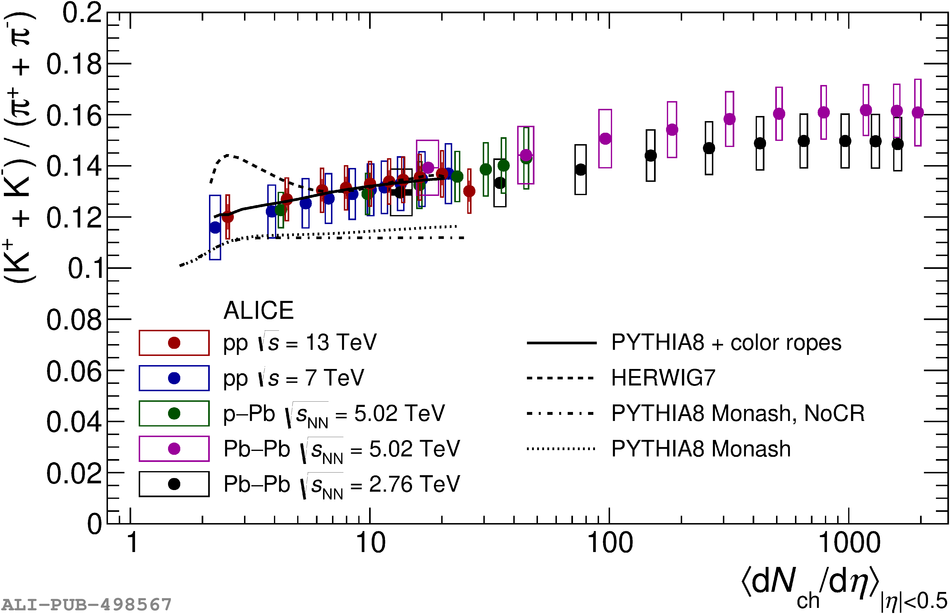
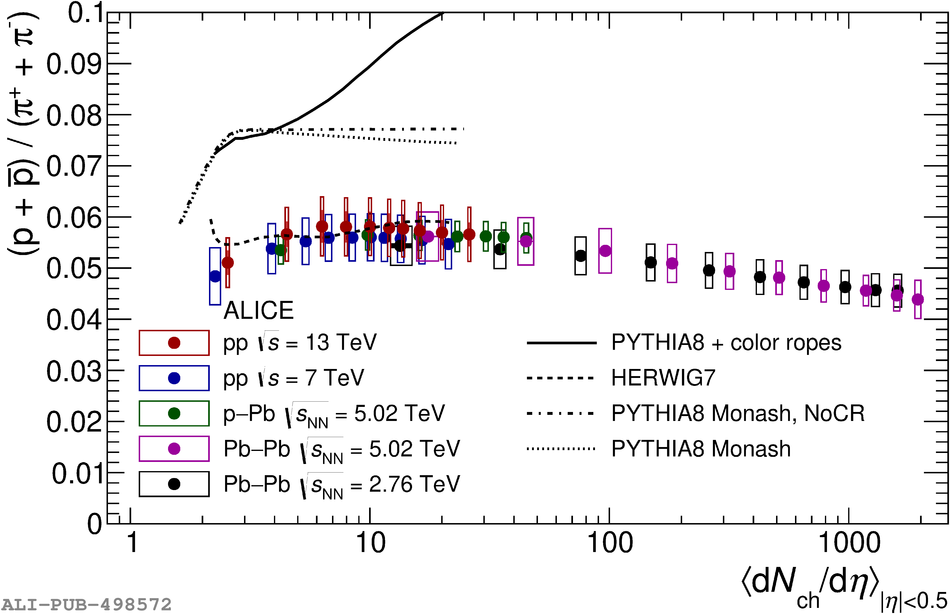
Integrated \kaon/\pion (top) and \pr/\pion (bottom) yield ratios as a function of charged-particle multiplicity density measured in pp, p--Pb, and Pb--Pb collisions at different center-of-mass energies. Empty (shaded) boxes represent total (multiplicity uncorrelated) systematic uncertainties. Black lines represent predictions from different MC generators for pp collisions at \cme{13}. References from .

Figure 6

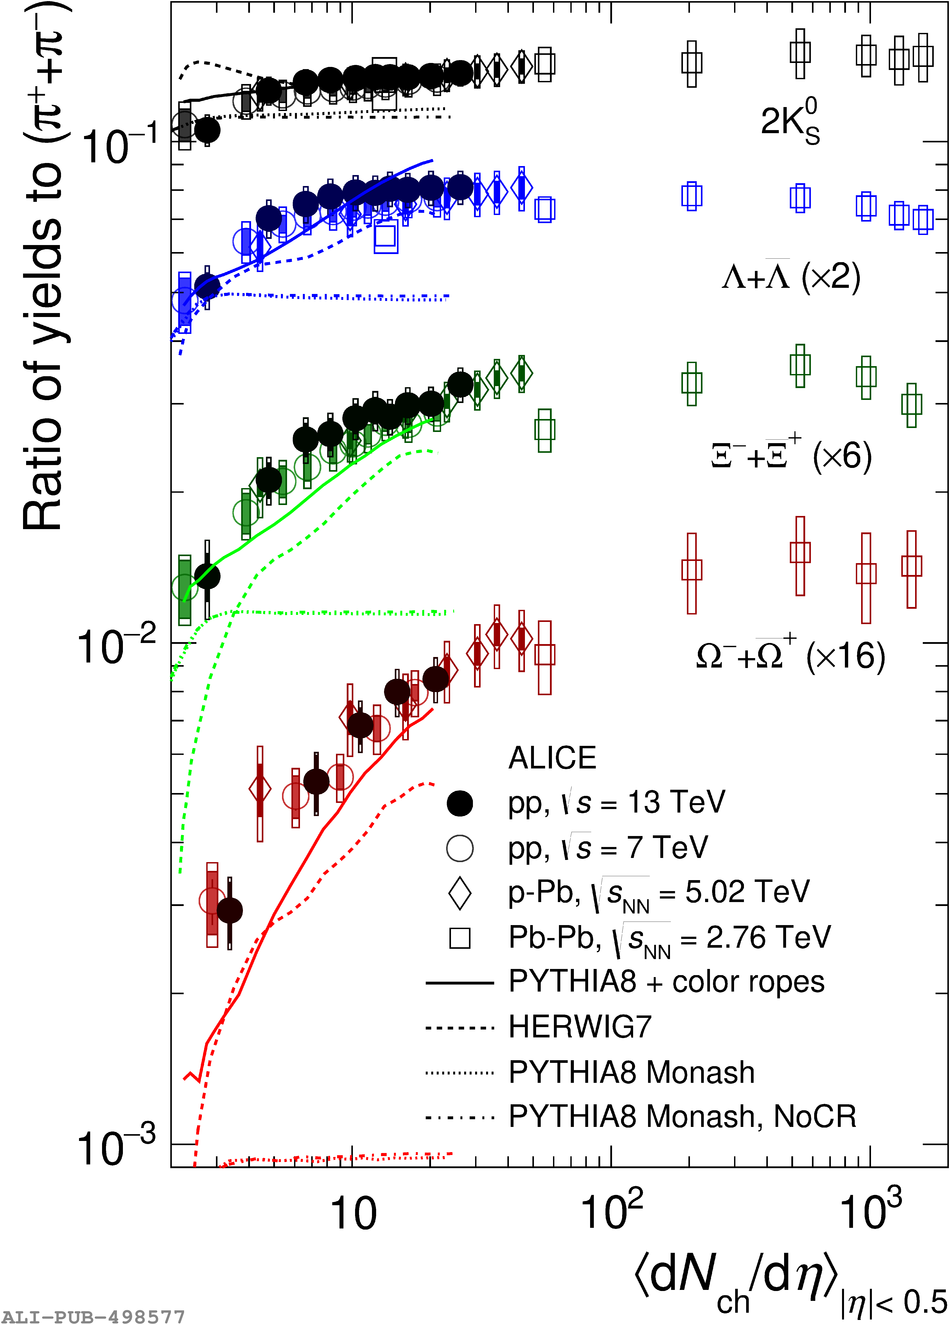
Integrated strange hadron-to-pion ratios as a function of \mdNde measured in pp, p--Pb, and Pb--Pb collisions. The open (shaded) boxes around markers represent full (multiplicity uncorrelated) systematic uncertainties. Different lines represent predictions from different MC generators for pp collisions at \cme{13}. References from .

Figure 7

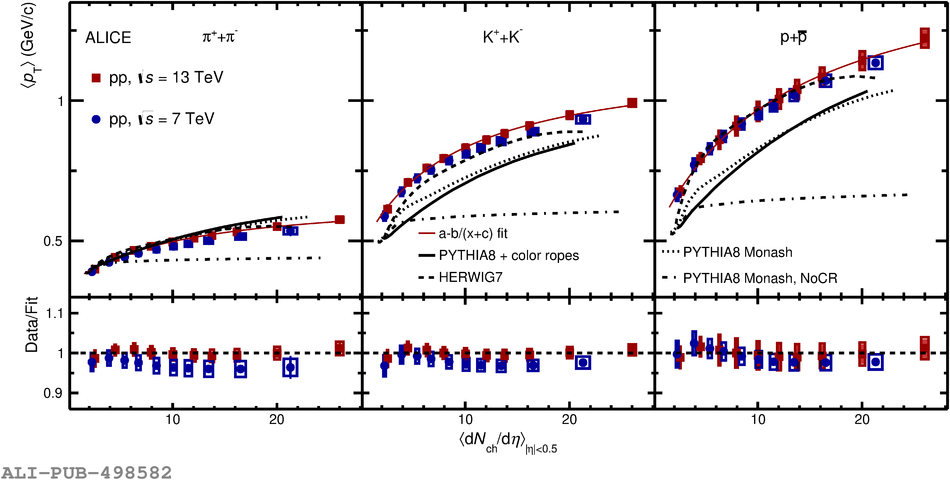
Upper panels: average transverse momenta of \pion, \kaon, and \pr as a function of charged-particle multiplicity density measured in pp collisions at \cme{\textrm{7 and 13}}. The red solid line represents $a-b(c-\mdNde)^{-1}$ fit to the 13 TeV data to guide the eye. Open (shaded) boxes represent total (multiplicity uncorrelated) systematic uncertainties. Black lines represent predictions from different MC generators for pp collisions at \cme{13}. Bottom panels: ratios of \mpT to the fits. Data at \cme{7} are from .