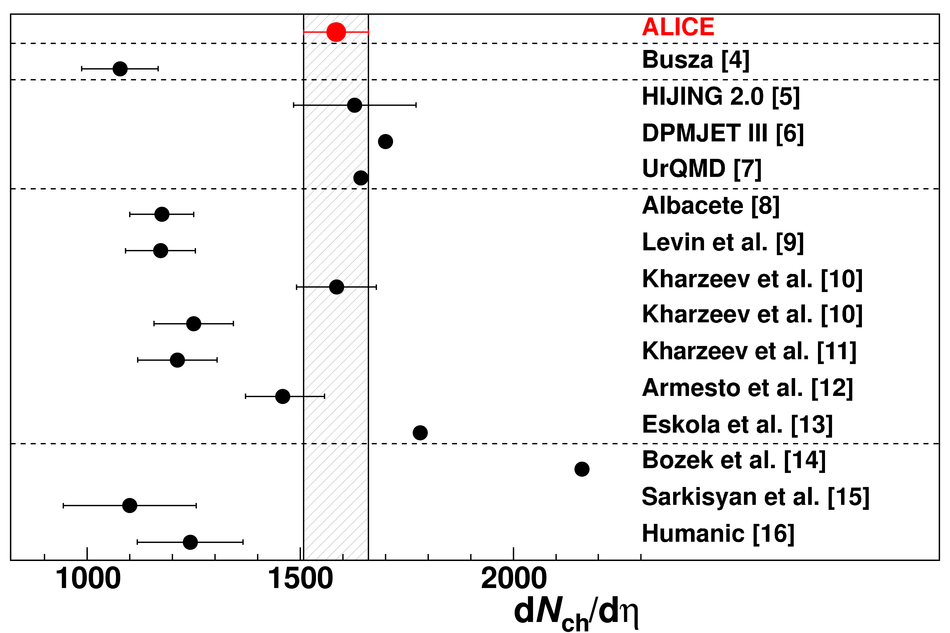
The first measurement of the charged-particle multiplicity density at mid-rapidity in Pb-Pb collisions at a centre-of-mass energy per nucleon pair $\sqrt{s_{\rm NN}}$ = 2.76 TeV is presented. For an event sample corresponding to the most central 5% of the hadronic cross section the pseudo-rapidity density of primary charged particles at mid-rapidity is 1584 $\pm$ 4 (stat) $\pm$ 76 (sys.), which corresponds to 8.3 $\pm$ 0.4 (sys.) per participating nucleon pair. This represents an increase of about a factor 1.9 relative to pp collisions at similar collision energies, and about a factor 2.2 to central Au-Au collisions at $\sqrt{s_{\rm NN}}$ = 0.2 TeV. This measurement provides the first experimental constraint for models of nucleus-nucleus collisions at LHC energies.
Phys. Rev. Lett. 105 (2010) 252301
e-Print: arXiv:1011.3916 | PDF | inSPIRE
CERN-PH-EP-2010-060
Figure 1
Upper panel: Correlation of ZDC and the VZERO response in hadronic collisions Lower panel: Distribution of the sum of amplitudes in the VZERO scintillator tiles (black histogram); inset shows the low amplitude part of the distribution The red line shows the fit of the Glauber calculation to the measurement The fit was performed above the cut indicated in the inset, avoiding the region at low amplitudes dominated by the electromagnetic processes The shaded area corresponds to the most central 5% of hadronic collisions |  |

Figure 3
Charged particle pseudo-rapidity density per participant pair for central nucleus-nucleus [17-25] and non-single diffractive pp ($\mathrm {p\overline{p}}$) collisions [26-32],as a function of $\snn$ The solid lines $\propto s_{\rm NN}^{0.15}$ and $\propto s_{\rm NN}^{0.11}$ are superimposed on the heavy-ion and pp ($\mathrm {p\overline{p}}$) data, respectively. | 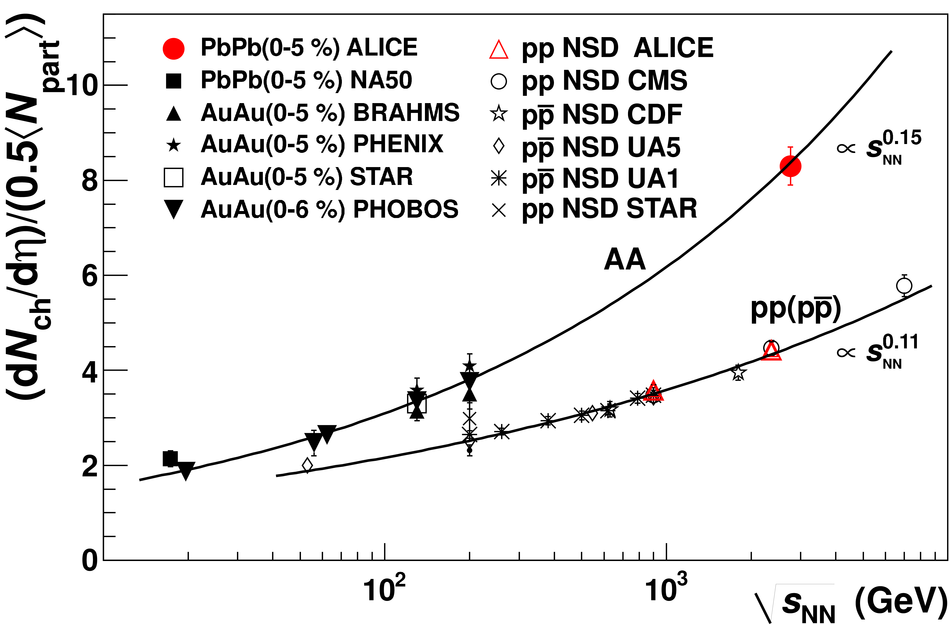 |