Left: Invariant mass distribution for muon pairs satisfying the event selection described in the text. The dashed green line corresponds to the background. The solid magenta and red lines correspond to Crystal Ball functions representing \jpsi and \psip signals, respectively. The solid blue line corresponds to the sum of background and signal functions. Right: transverse momentum distribution for muon pairs in the range $2.85 < m_{\mu\mu} < 3.35$ GeV/$c^{2}$(around the \jpsi mass). | 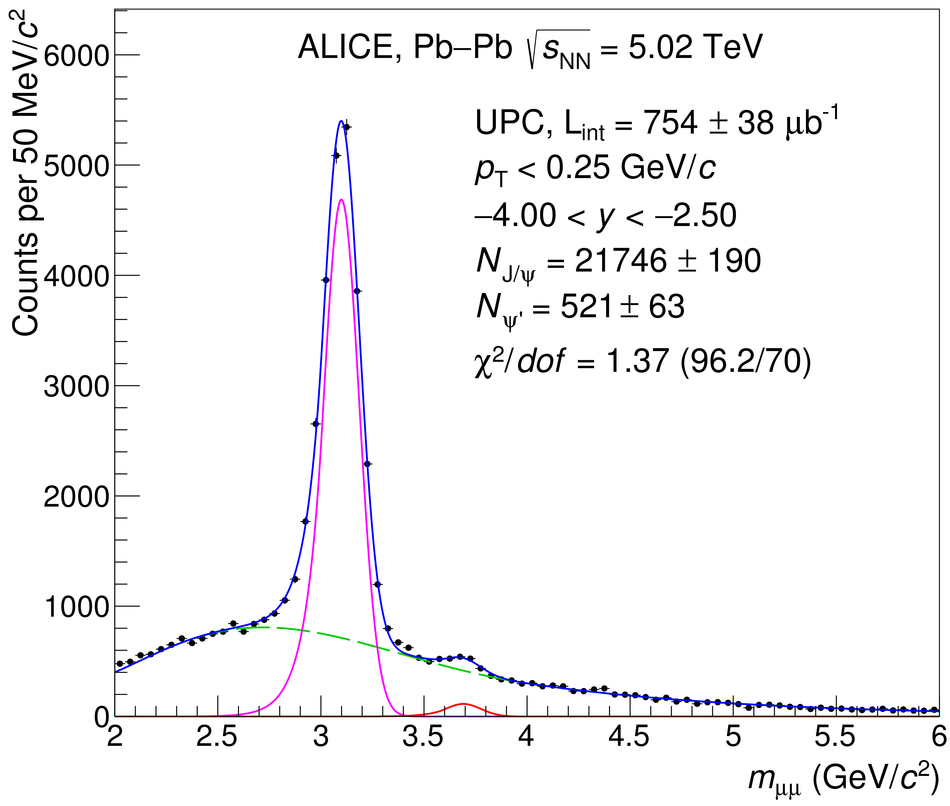 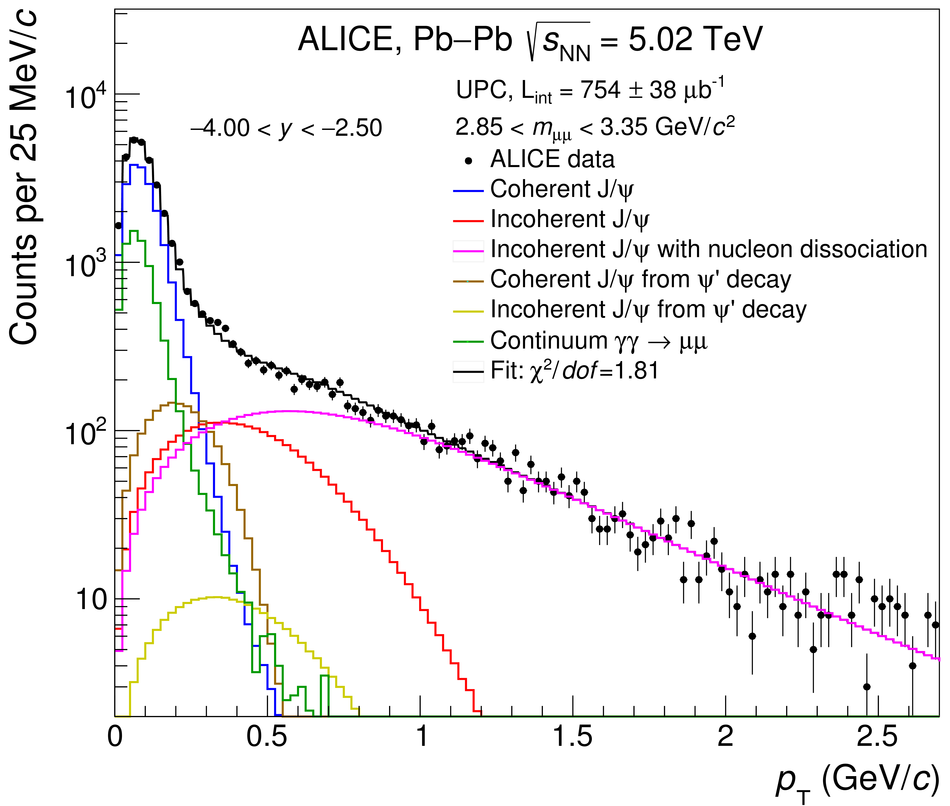 |