Average of the ratio of $\Dzero$ and $\Dplus$ yields measured as a function of $\pt$ in the ESE-selected samples to those in the unbiased sample, in $\PbPb$ collisions at $\sqrtsNN=5.02 \TeV$ for the 10--30\% (left panel) and 30--50\% (right panel) centrality classes. Vertical error bars represent the statistical uncertainty, empty boxes the total systematic uncertainty. | 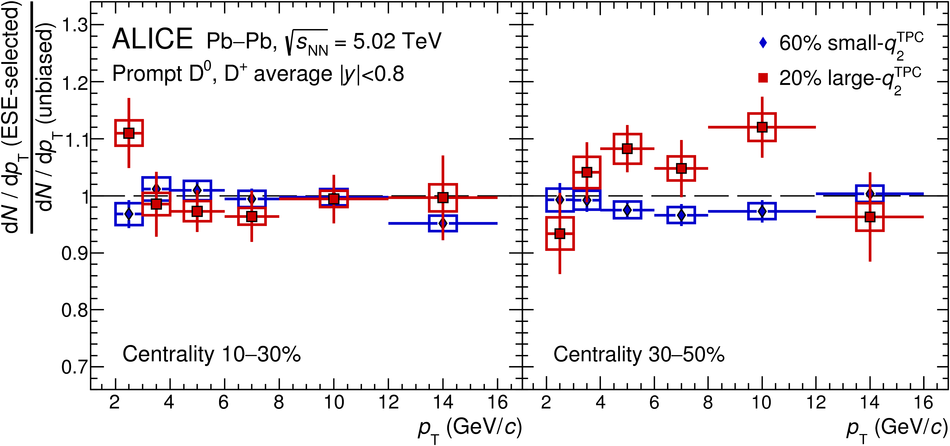 |