$\Dzero$ (left column) and $\Dplus$ (right column) $v_2$ as a function of $\pt$ for the small-$\qTPC$ and large-$\qTPC$ samples (see text for details), in $\PbPb$ collisions at $\sqrtsNN=5.02 \TeV$ in the 10--30\% (top row) and 30--50\% (bottom row) centrality classes. The symbols are positioned horizontally at the average $\pt$ of the reconstructed D mesons. Vertical error bars represent the statistical uncertainty, empty boxes the systematic uncertainty associated with the D-meson anisotropy measurement and the event-plane resolution. Shaded boxes show the uncertainty due to feed-down from beauty-hadron decays. | 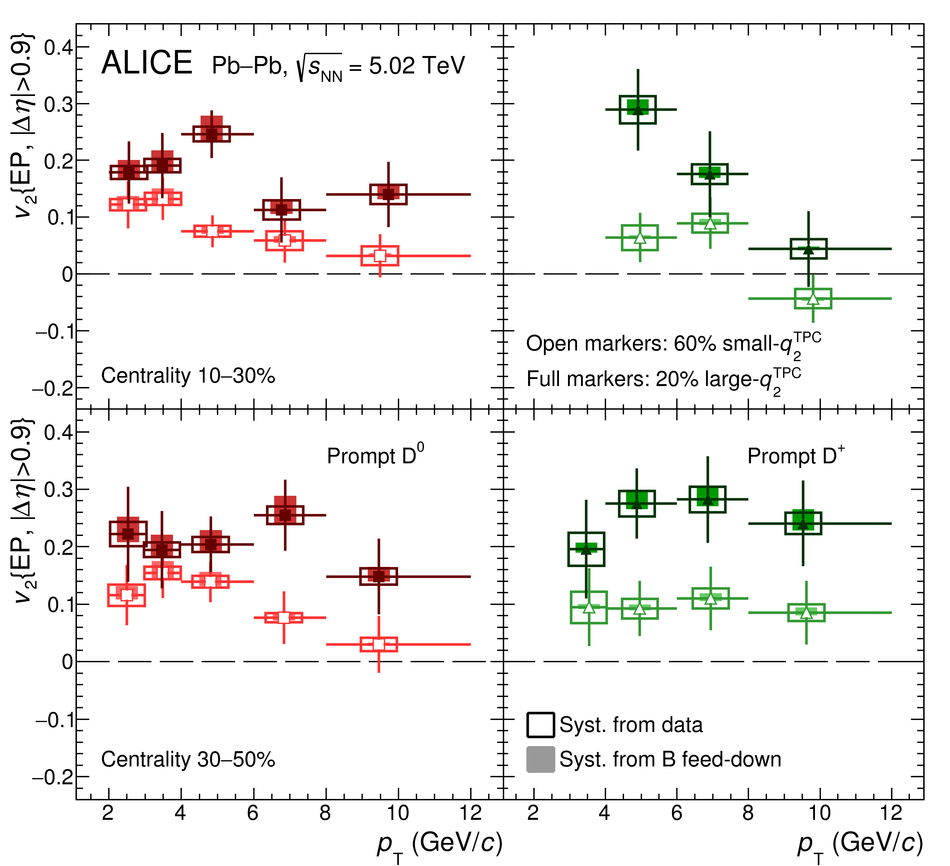 |