Invariant-mass distributions of $\Dzero$ candidates (left panel), $\Dplus$ candidates (middle panel) and mass-difference for $\Dstar$ candidates (right panel) in three $\pt$ intervals for the two $\Delta\varphi$ regions used in the EP method for $\PbPb$ collisions in the 10--30\% centrality class at $\sqrtsNN=5.02 \TeV$. The solid curves represent the total fit functions and the dotted curves the background functions, as described in the text. | 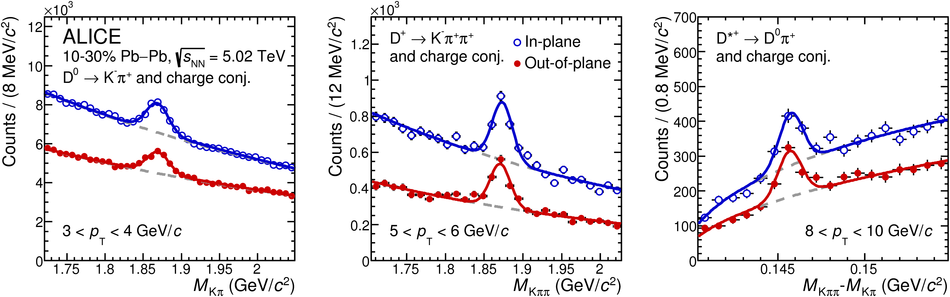 |