Left: distribution of $\qTPC$ (see text for details) as a function of centrality in $\PbPb$ collisions at $\sqrtsNN=5.02 \TeV$. The red long-dashed and the blue short-dashed lines represent the limits for the 20\% and the 60\% of events with largest and smallest $\qTPC$, respectively. Right: $\qTPC$ distributions for the unbiased, small-$\qTPC$ and large-$\qTPC$ samples for the 30--50\% centrality class (see text for details). | 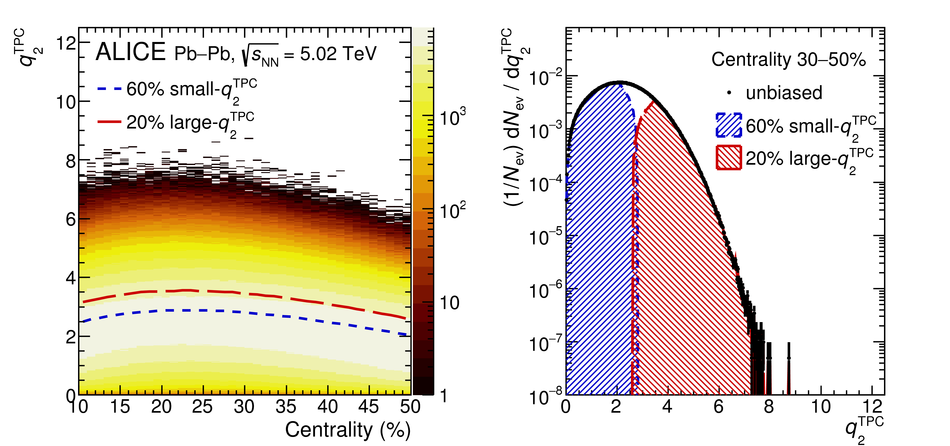 |