Results for the fit of the pp data at $\sqrt{s}=13$ TeV. The p-p correlation function (left panel) is fitted with CATS (blue line) and the $\Lambda$-$\Lambda$ correlation function (right panel) is fitted with the Lednicky model (yellow line). The dashed line represents the linear baseline from Eq. 5, while the dark dashed-dotted line on top of the $\Lambda$-$\Lambda$ data shows the expected correlation based on quantum statistics alone, in case of a strong interaction potential compatible with zero | 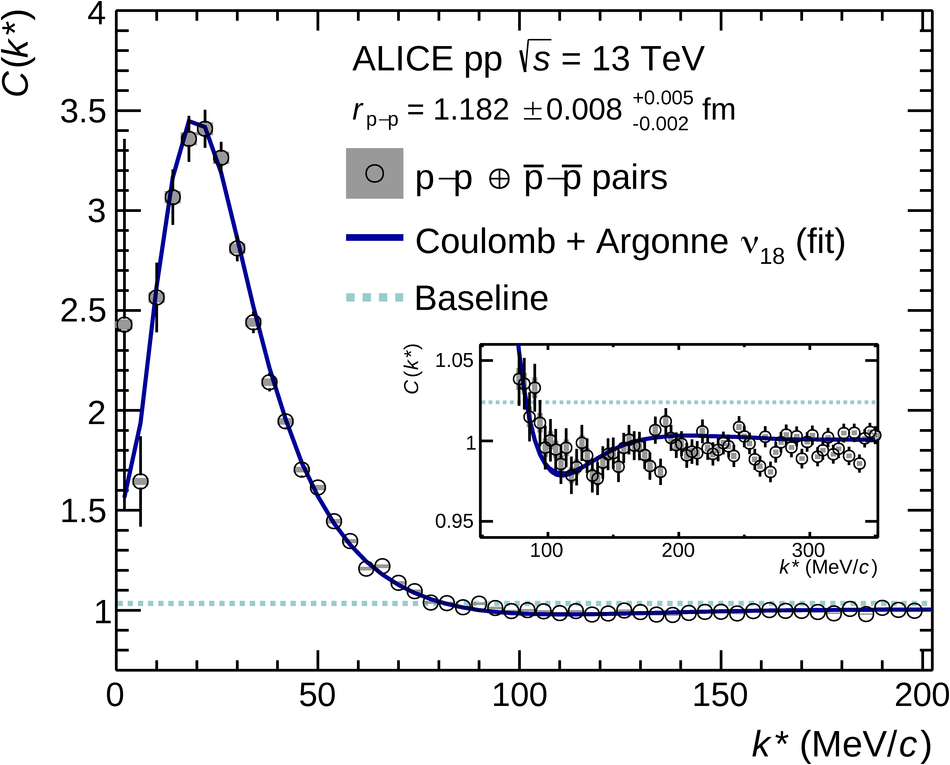  |