The production rates and the transverse momentum distribution of strange hadrons at mid-rapidity ($\ |y\ | <~ 0.5$) are measured in proton-proton collisions at $\sqrt{s}$ = 13 TeV as a function of the charged particle multiplicity, using the ALICE detector at the LHC. The production rates of $\rm{K}^{0}_{S}$, $\Lambda$, $\Xi$, and $\Omega$ increase with the multiplicity faster than what is reported for inclusive charged particles. The increase is found to be more pronounced for hadrons with a larger strangeness content. Possible auto-correlations between the charged particles and the strange hadrons are evaluated by measuring the event-activity with charged particle multiplicity estimators covering different pseudorapidity regions. When comparing to lower energy results, the yields of strange hadrons are found to depend only on the mid-rapidity charged particle multiplicity. Several features of the data are reproduced qualitatively by general purpose QCD Monte Carlo models that take into account the effect of densely-packed QCD strings in high multiplicity collisions. However, none of the tested models reproduce the data quantitatively. This work corroborates and extends the ALICE findings on strangeness production in proton-proton collisions at 7 TeV.
Eur. Phys. J. C 80, 167 (2020)
HEP Data
e-Print: arXiv:1908.01861 | PDF | inSPIRE
CERN-EP-2019-168
Figure 1
Invariant mass distributions for \kzero, \lmb, \pXi, \pOmegain different V0M multiplicity and \pt intervals. The candidates are reconstructed in \yless{0.5}. The grey areas delimited by theshort-dashed lines are used for signal extraction in the bin counting procedure. The red dashed linesrepresent the fit to the invariant mass distributions, shown for drawing purpose only. | 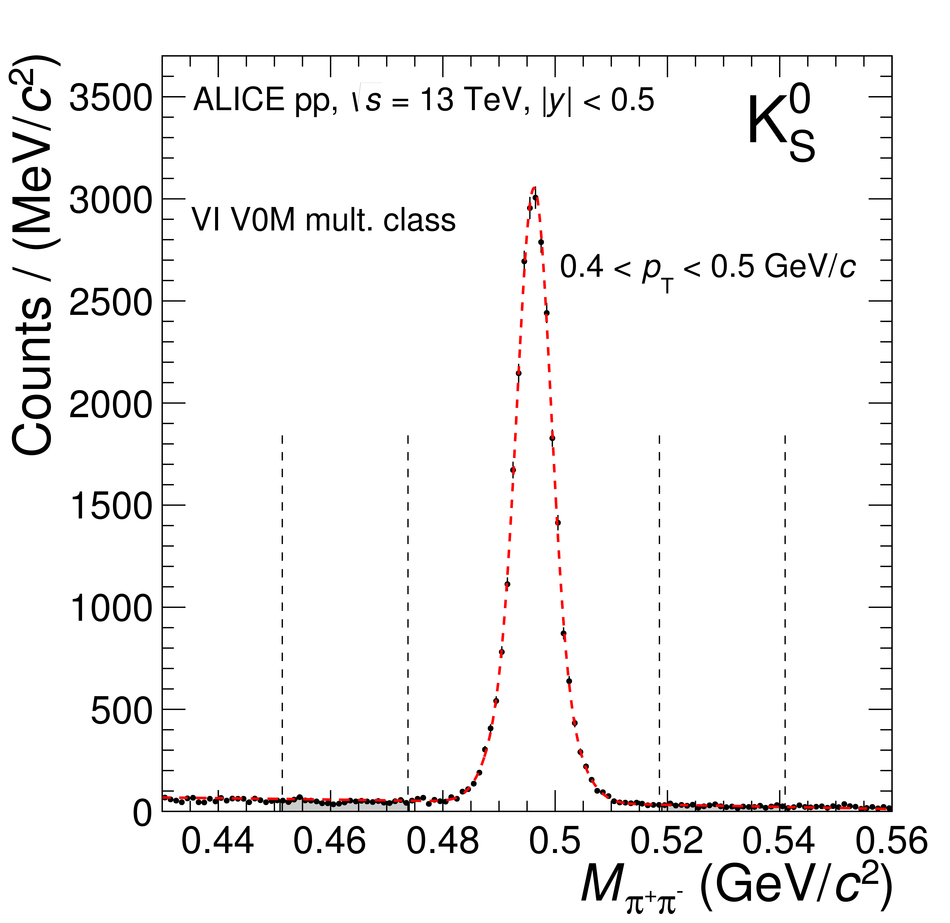 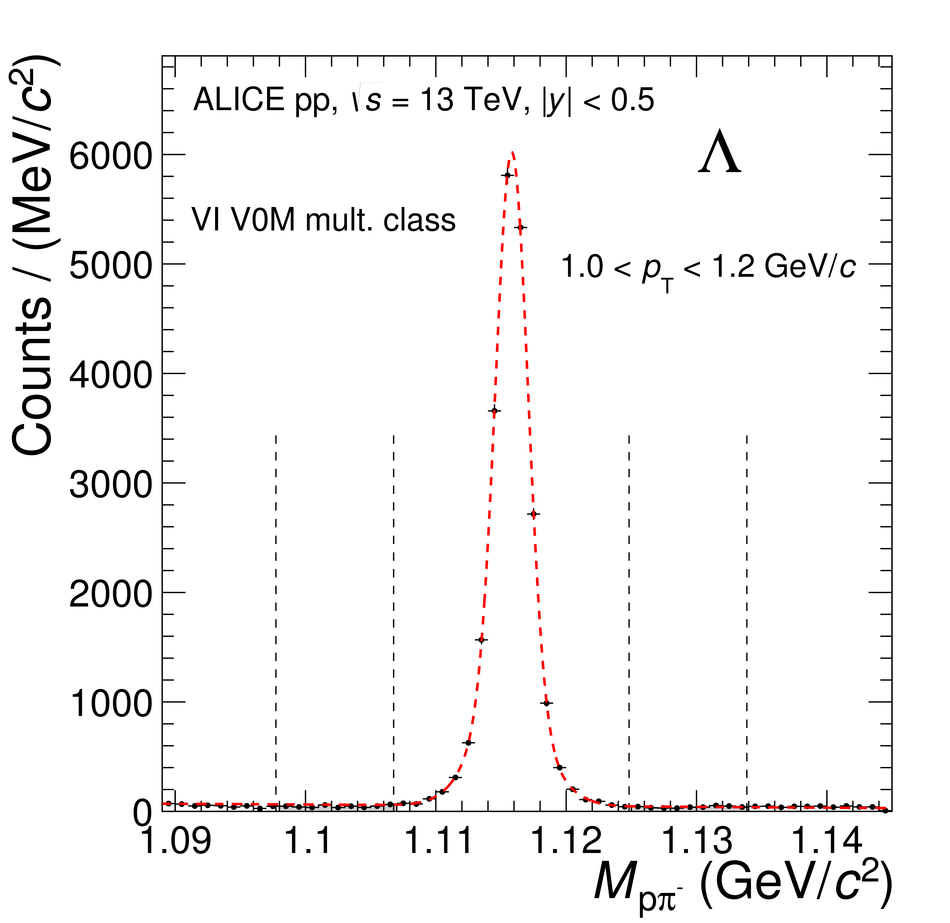  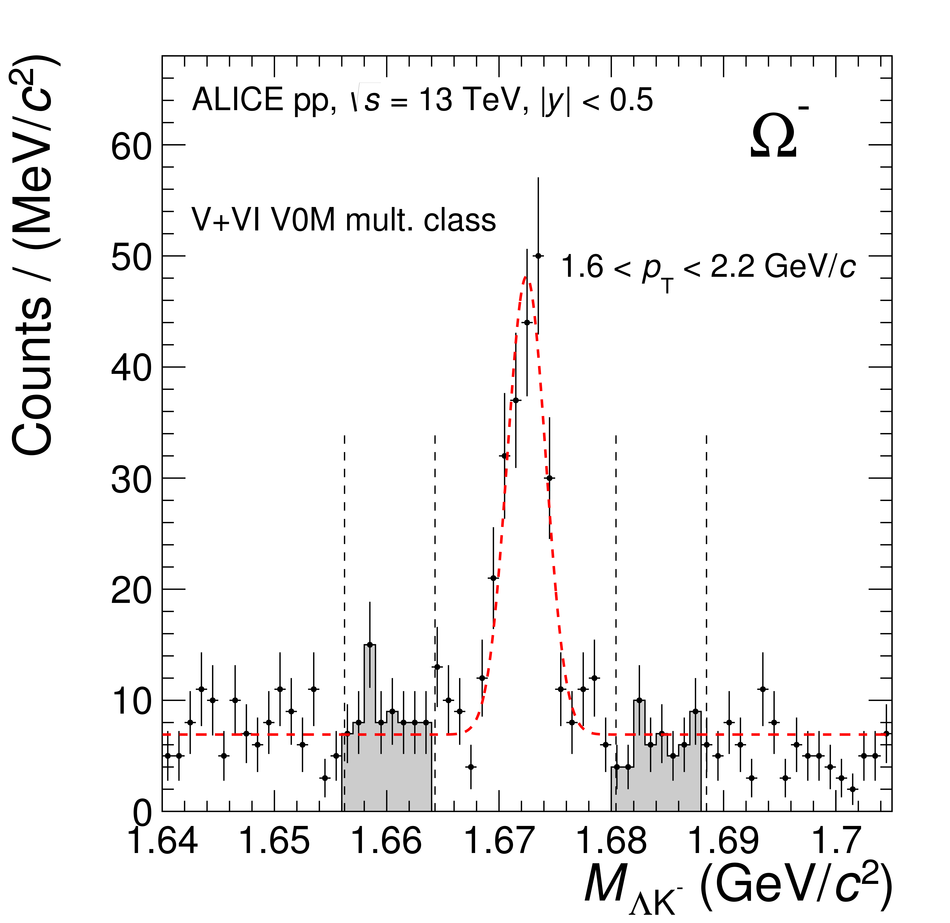 |
Figure 2
Transverse momentum distribution of \pKzero, \sLambda, \sXi, and \sOmega, for multiplicity classes selected using the V0 detector. Statistical and totalsystematic uncertainties are shown by error bars and boxes, respectively. In the bottom panels ratios of multiplicity dependent spectra to INEL $>$ 0 are shown The systematic uncertainties on the ratios are obtained by considering only contributions uncorrelated across multiplicity. The spectra are scaledby different factors to improve the visibility. The dashed curves represent Tsallis-L\'evy fits to the measured spectra. |  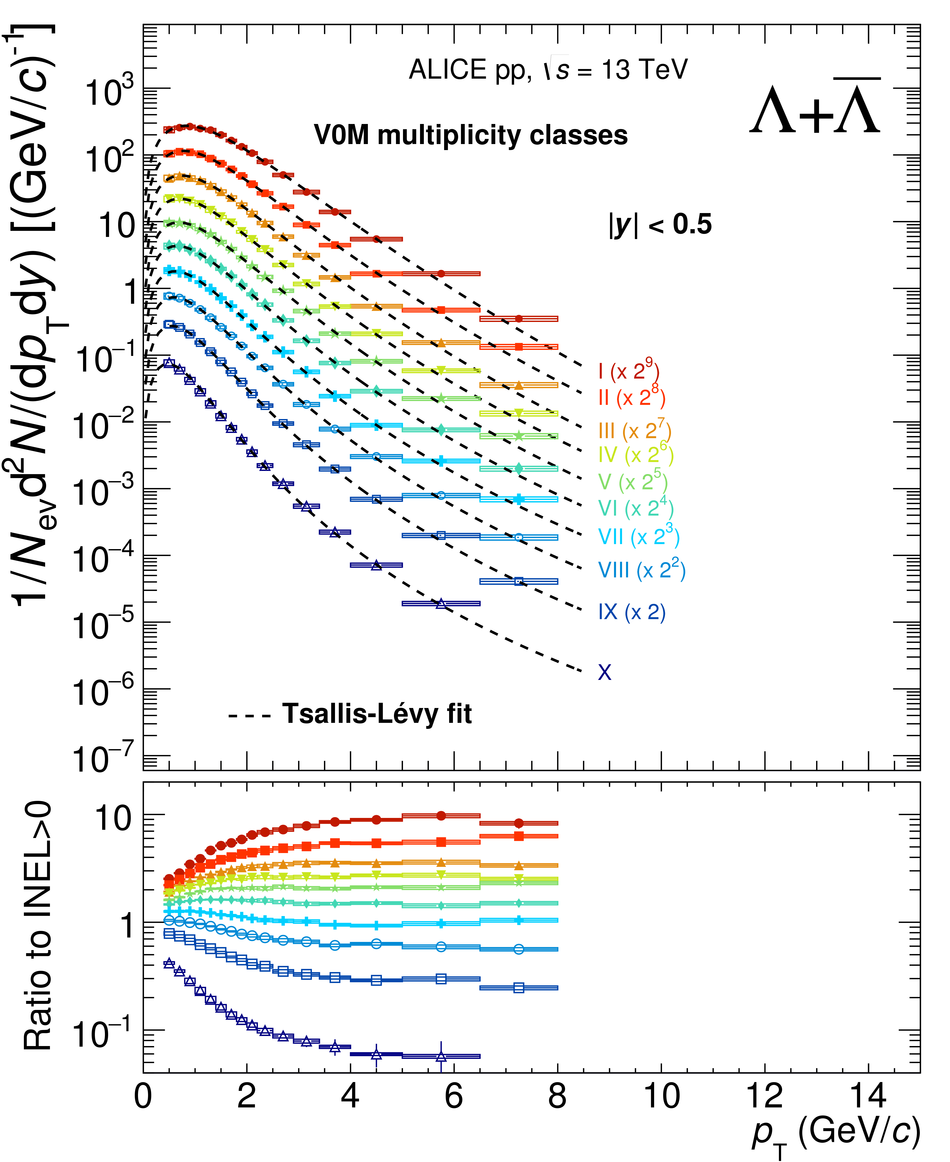  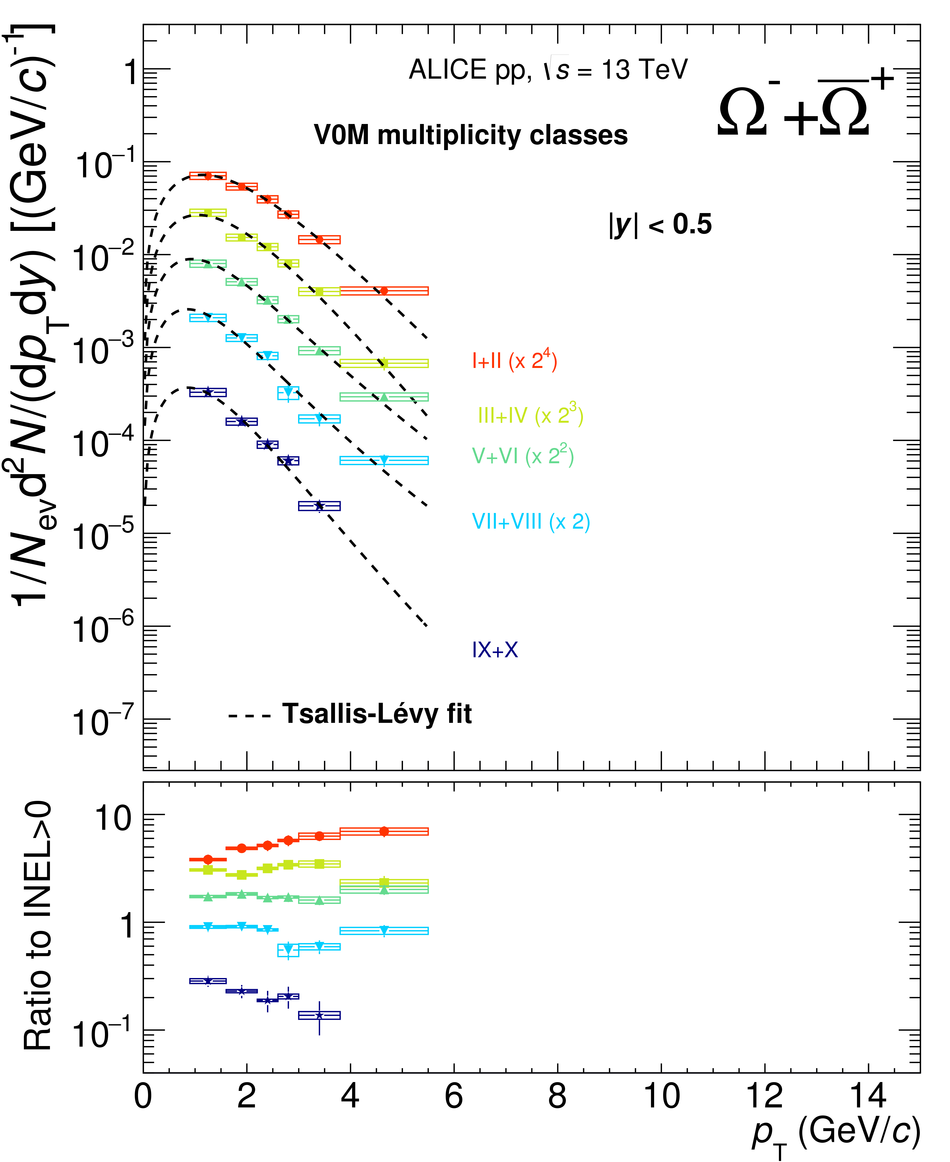 |
Figure 3
Transverse momentum distribution of \pKzero, \sLambda, \sXi, and \sOmega, for multiplicity classes selected using the tracklets in \etaless{0.8}. Statistical andtotal systematic uncertainties are shown by error bars and boxes, respectively. In the bottom panels ratios of multiplicity dependent spectra to INEL $>$ 0 are shown The systematic uncertainties on the ratios are obtained by considering only contributions uncorrelated across multiplicity. The spectra are scaledby different factors to improve the visibility. The dashed curves represent Tsallis-L\'evy fits to the measured spectra. | 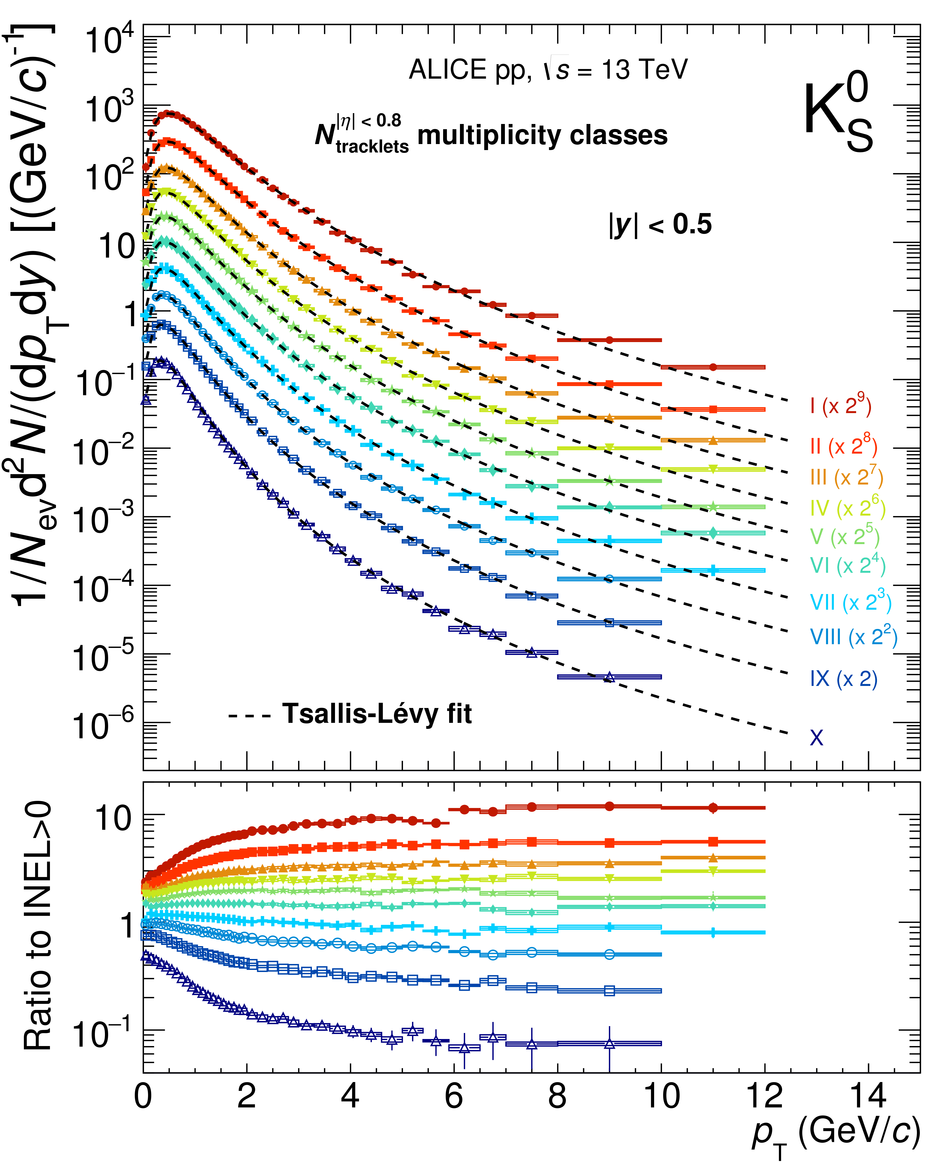 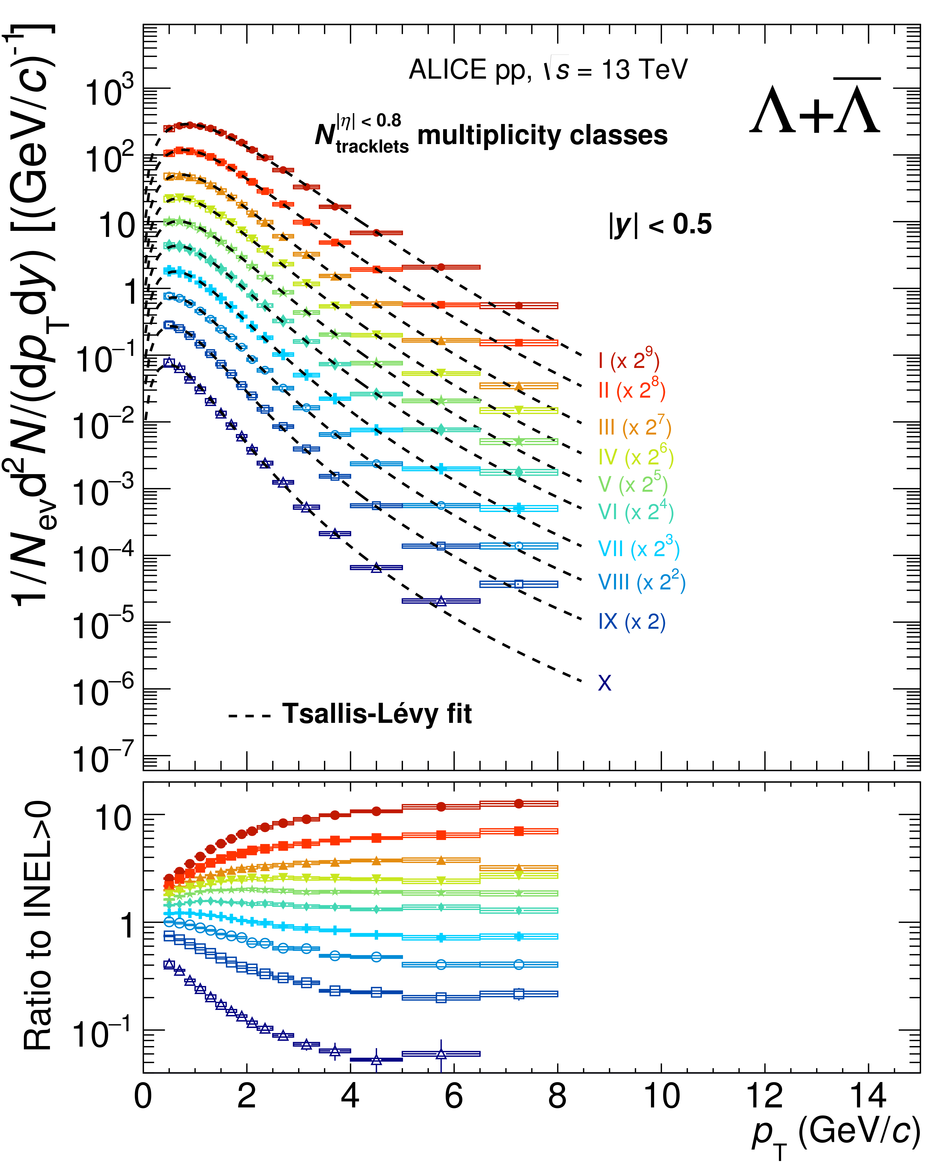 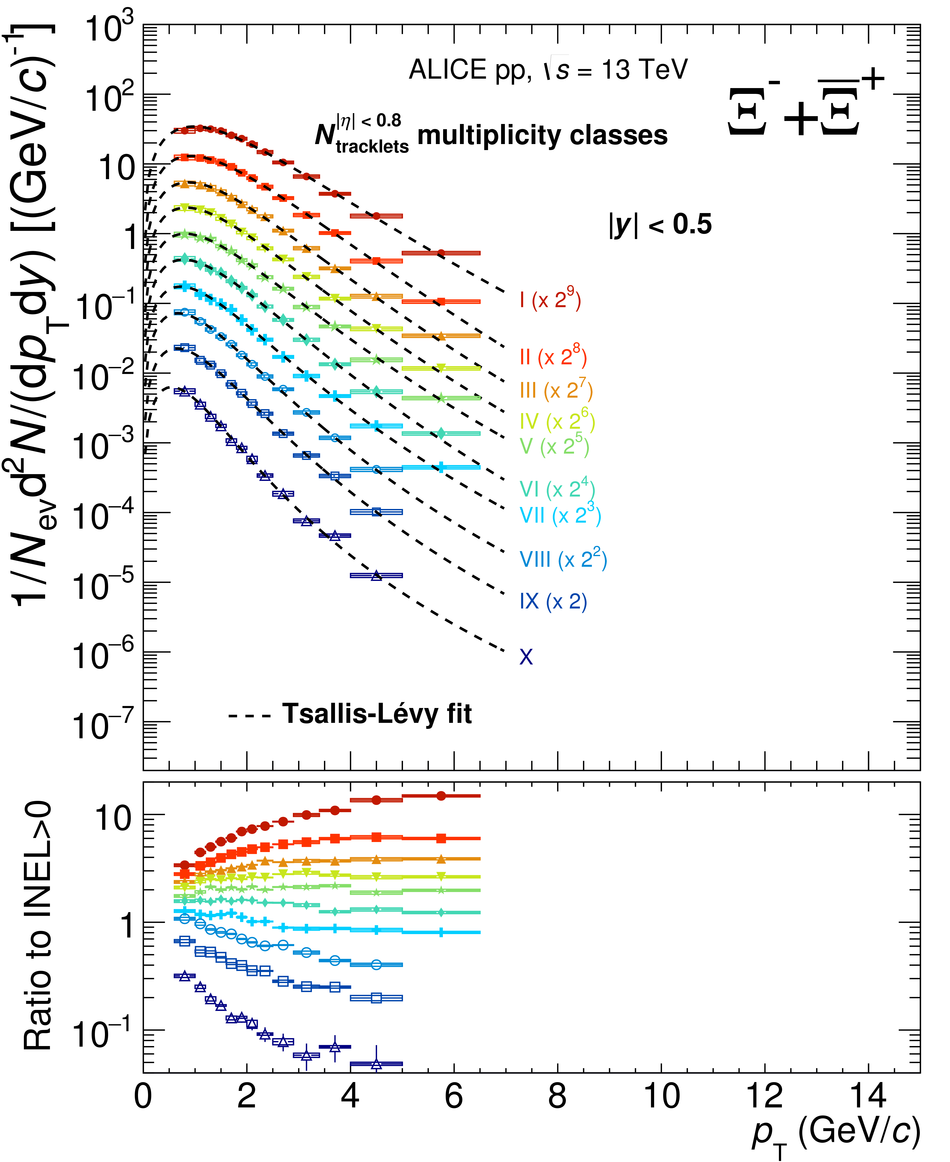  |
Figure 4
Transverse momentum distribution of \pKzero, \sLambda, \sXi, and \sOmega, for multiplicity classes selected using the tracklets in $0.8 < \left| \eta \right| < 1.5$. Statistical and totalsystematic uncertainties are shown by error bars and boxes, respectively. In the bottom panels ratios of multiplicity dependent spectra to INEL $>$ 0 are shown The systematic uncertainties on the ratios are obtained by considering only contributions uncorrelated across multiplicity. The spectra are scaledby different factors to improve the visibility. The dashed curves represent Tsallis-L\'evy fits to the measured spectra. | 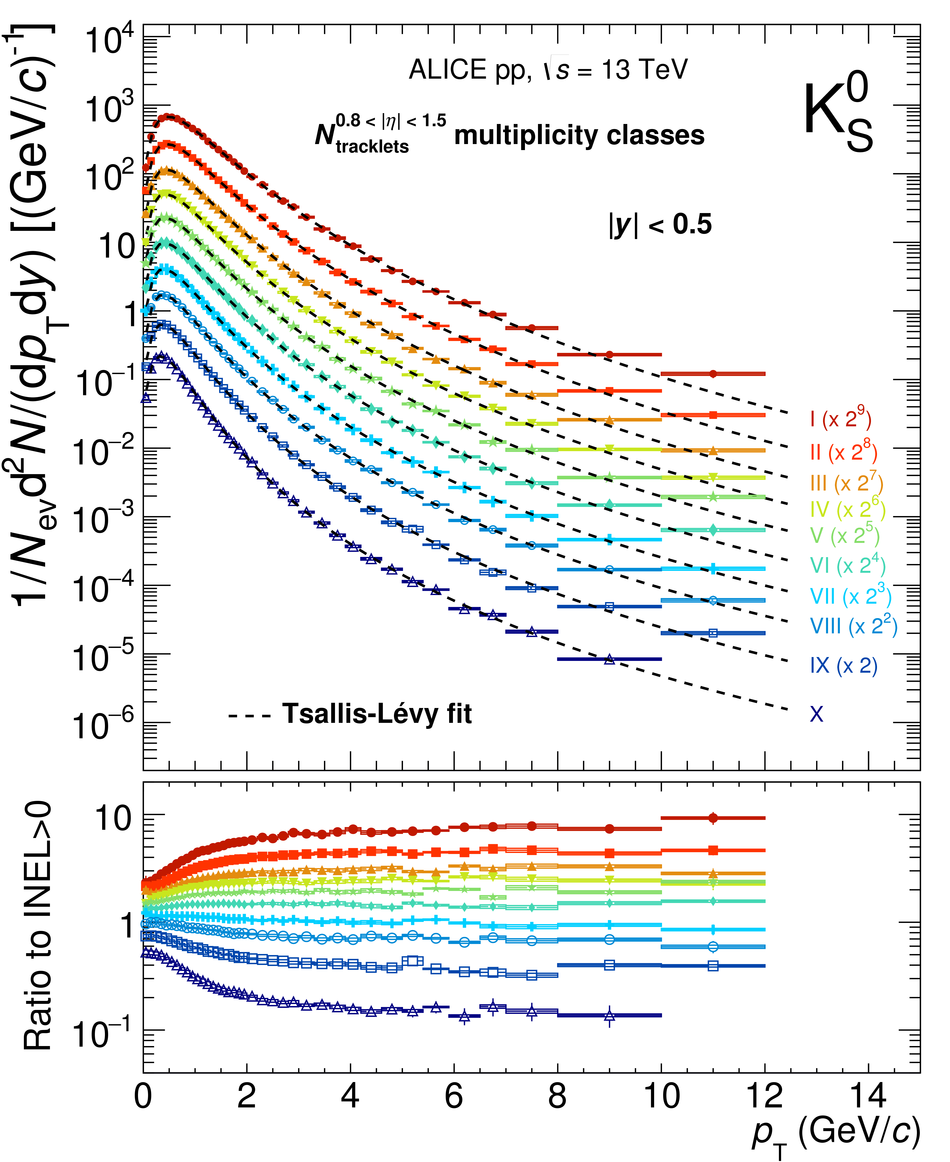 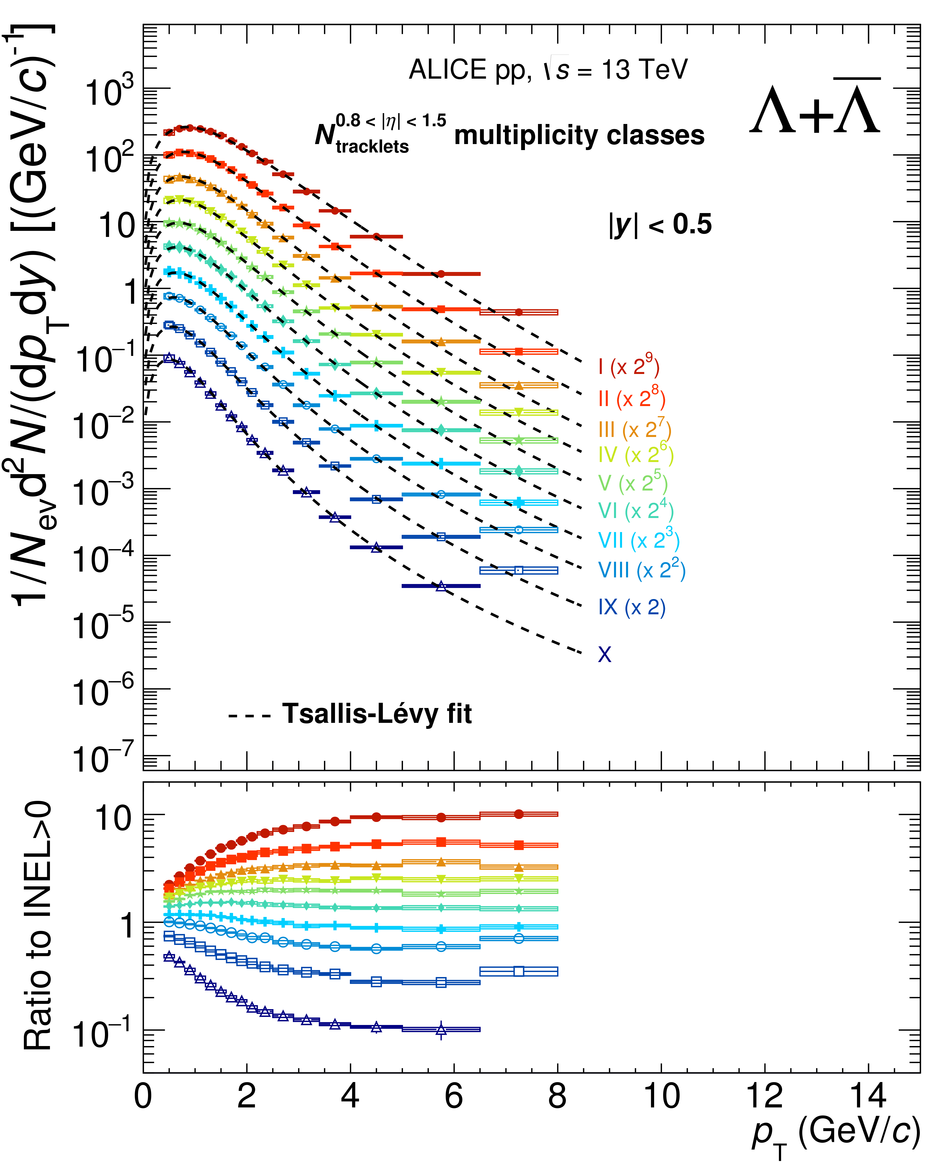 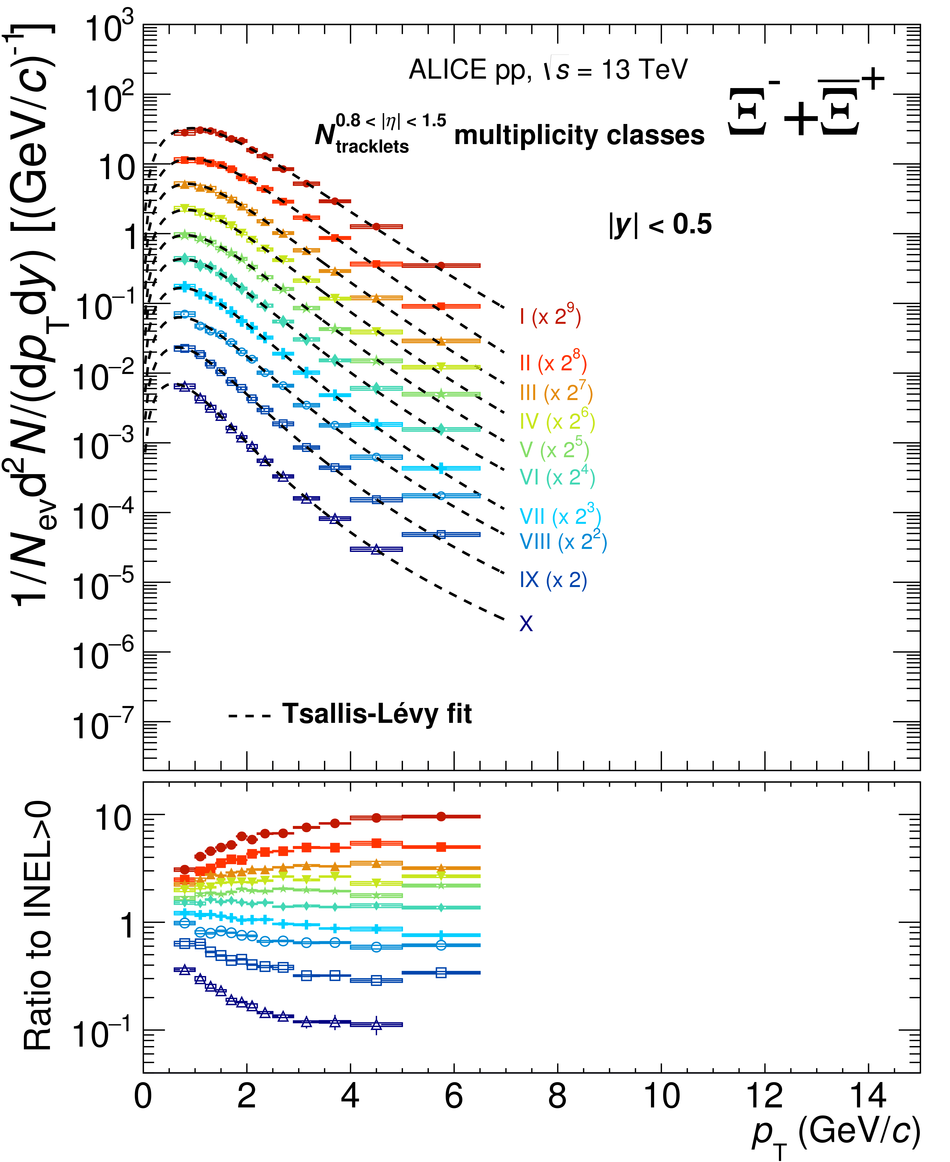 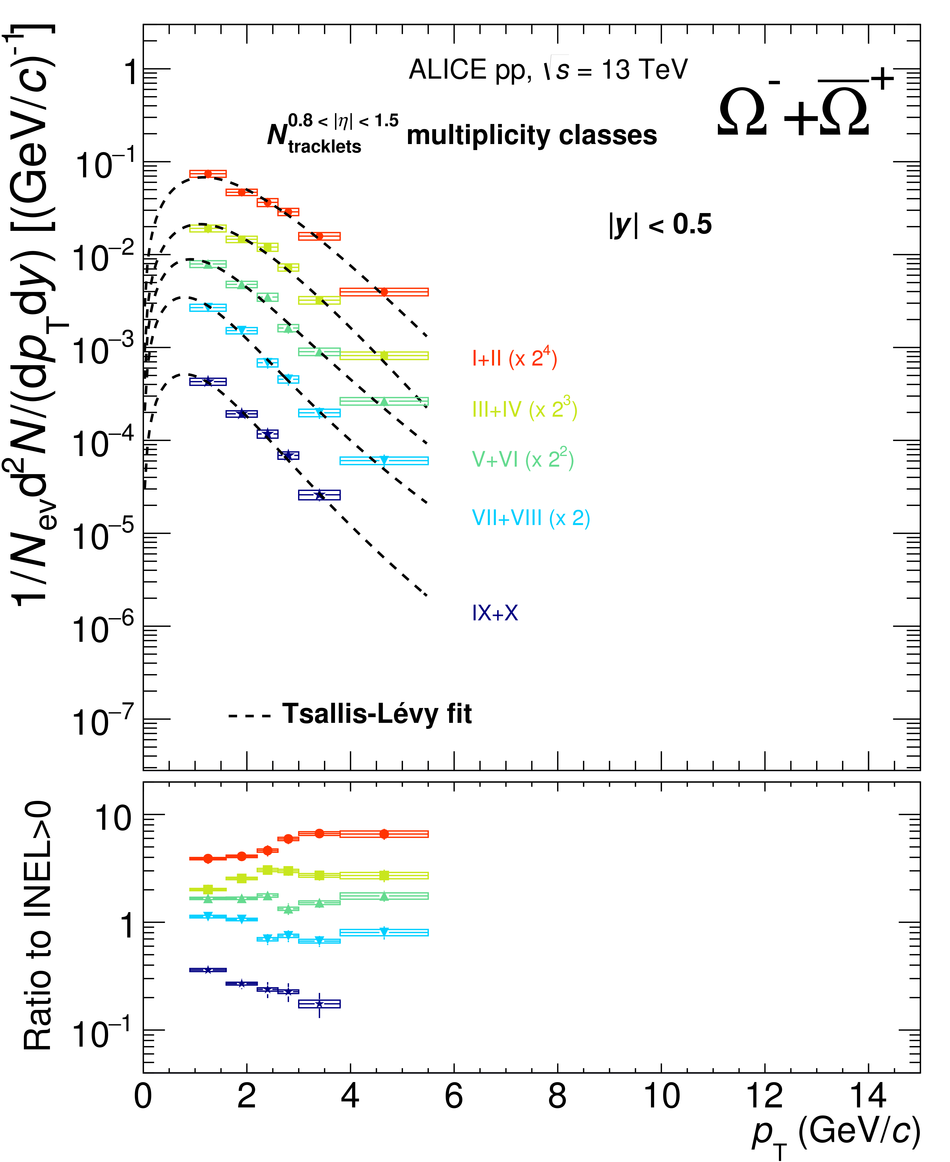 |
Figure 5
\avpT\ of \pKzero, \sLambda, \sXi, and \sOmega in multiplicity event classes selected according to different estimators (see text for details) Statistical and systematic uncertainties are shown by error bars and empty boxes, respectively. Shadowed boxes represent uncertainties uncorrelated across multiplicity. | 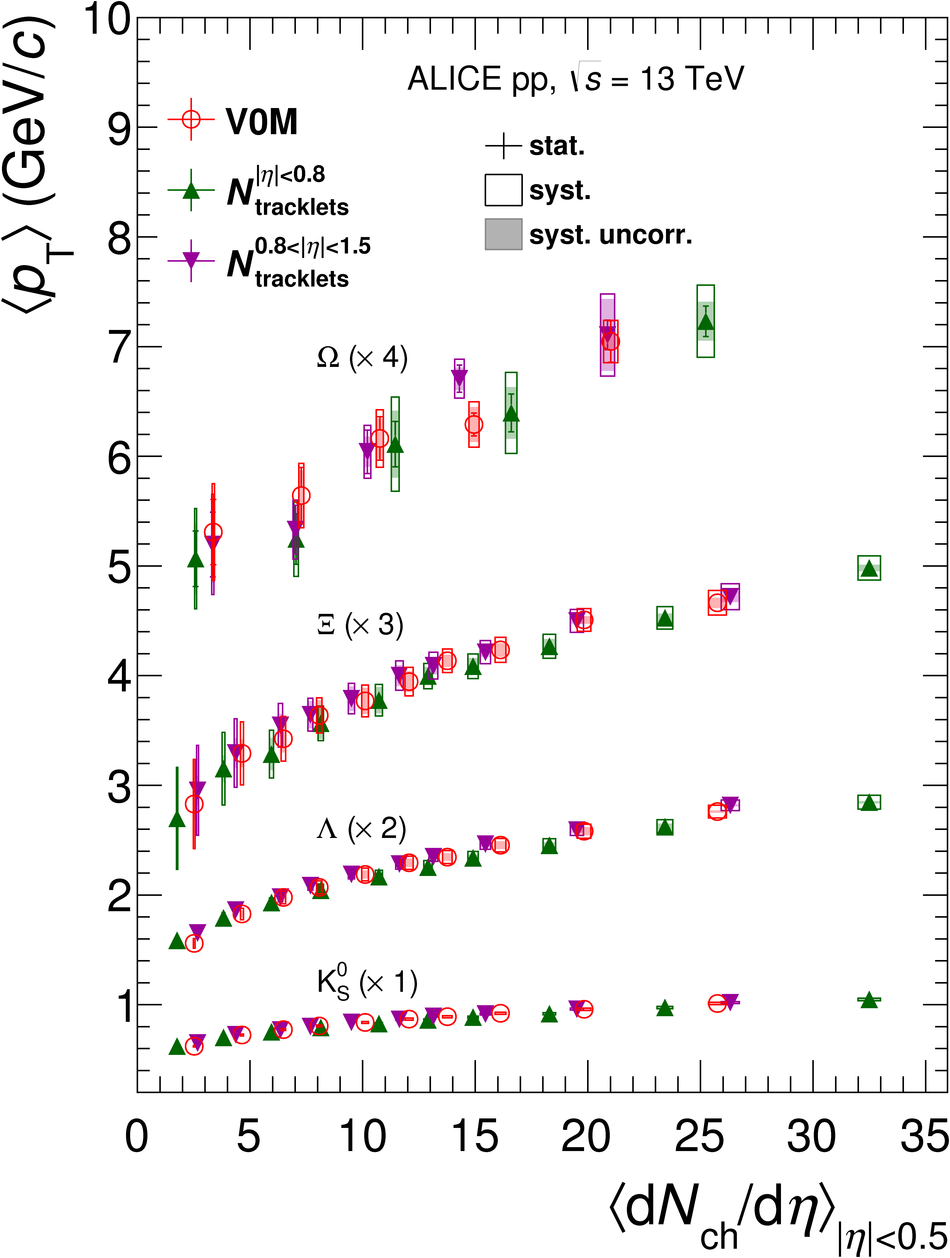 |
Figure 6
Self-normalised yields of strange hadrons integrated for \pt $> 4$ \gevc\ (3.8 \gevc\ for the \sOmega) versus the self-normalised charged particle multiplicity quoted using different multiplicity estimators (see text for details). Statistical and systematic uncertainties are shown by error bars and empty boxes, respectively. Shadowed boxes represent uncertainties uncorrelated across multiplicity. Strange particle yields are compared to expectations from Monte Carlo models. | 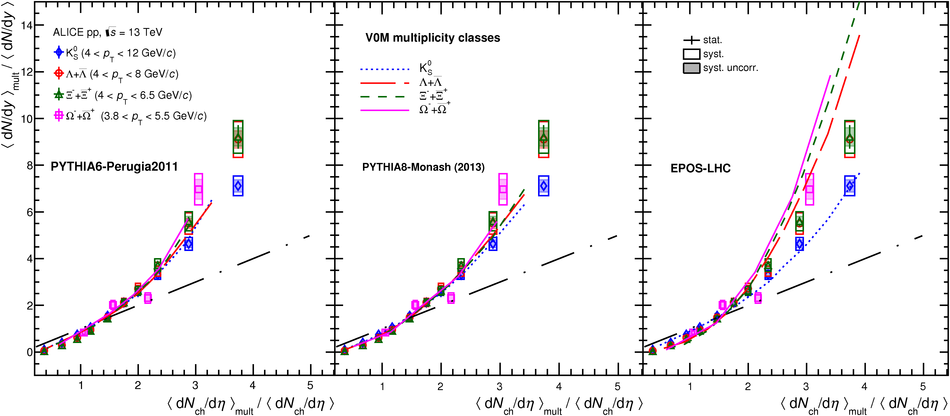 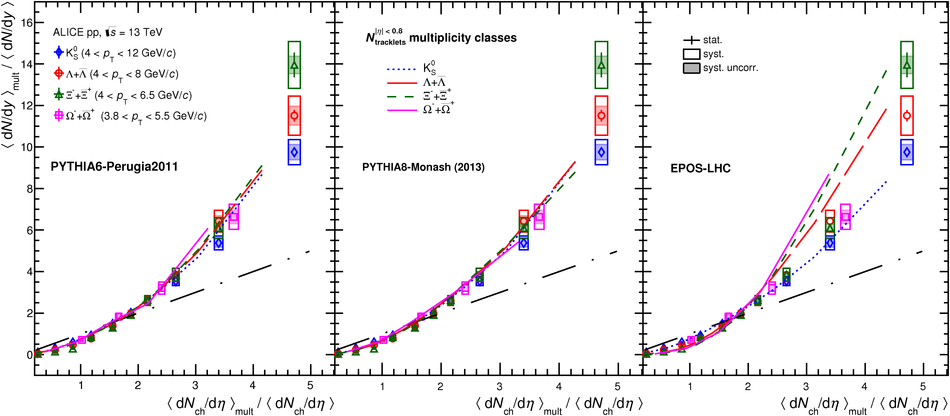 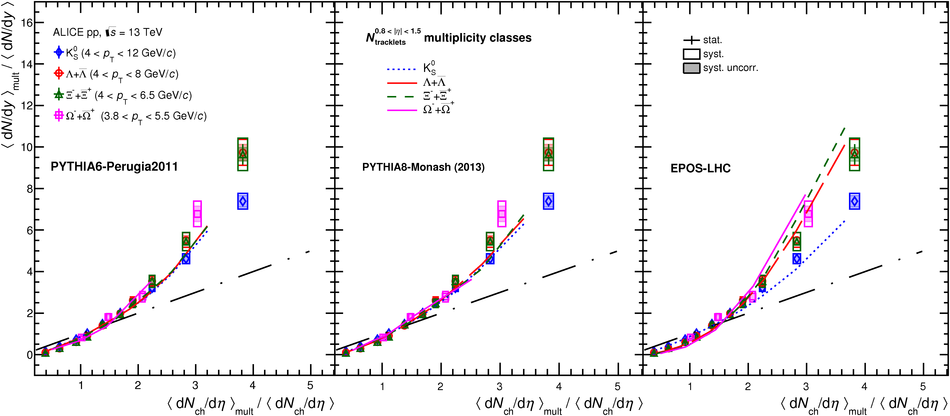 |
Figure 7
Ratio of \pt\ spectra of \pKzero, \sLambda and \sXi obtained with two different estimators for multiplicity classes with comparable average $\dNdeta$ value ($\langle \dNdeta \rangle \simeq 26$);the numerator does refer to the \NtrkEtaOut\ (\NtrkEtaIn) estimator while the denominator refers to the V0M estimator. Statistical and systematic uncertainties are shown by error bars and empty boxes, respectively. Shadowed boxes represent uncertainties uncorrelated across multiplicity. | 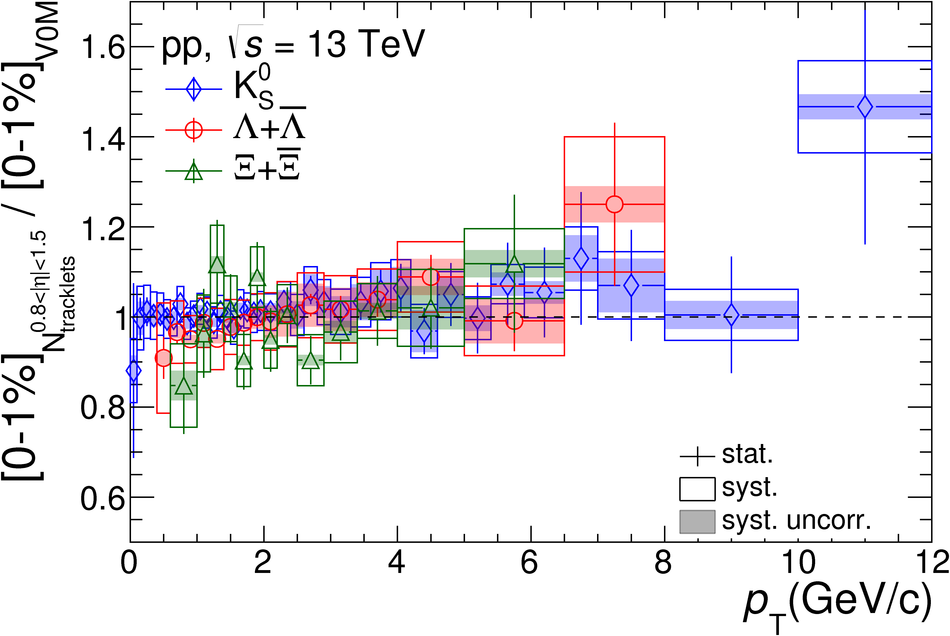 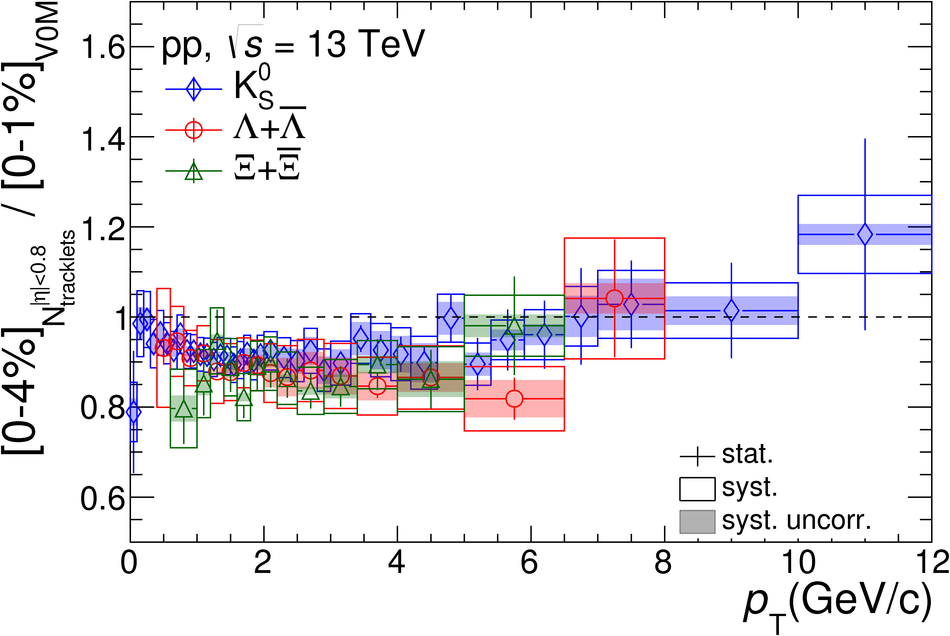 |
Figure 8
\dndy\ (integrated over the full \pt\ range) as a function of multiplicity for different strange particle species reported for different multiplicity classes (see text for details) Error bars and boxes represent statistical and total systematic uncertainties, respectively. The bin-to-bin systematic uncertainties are shown by shadowed boxes. | 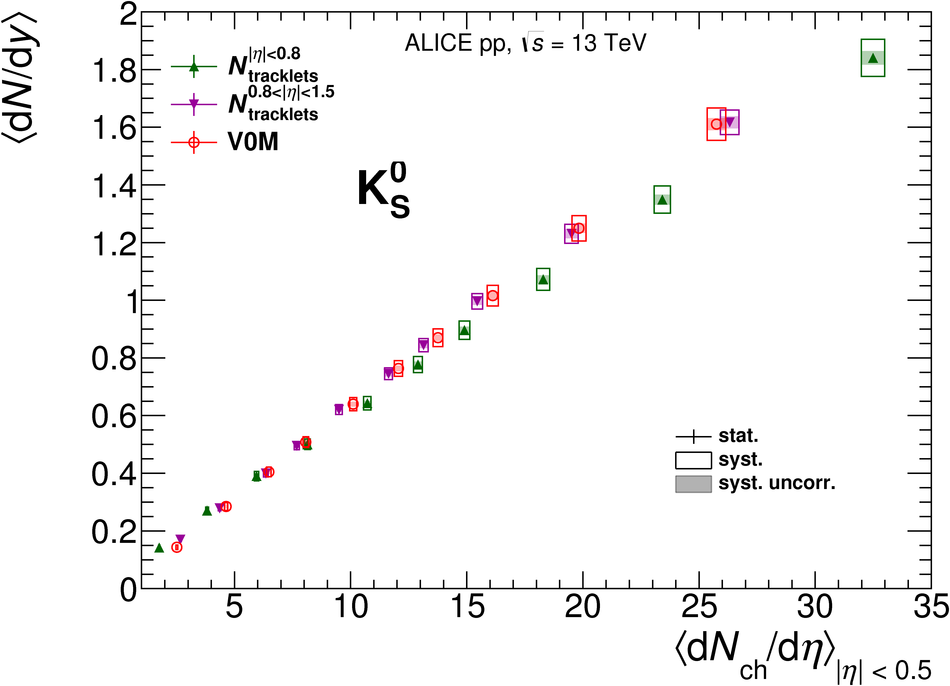 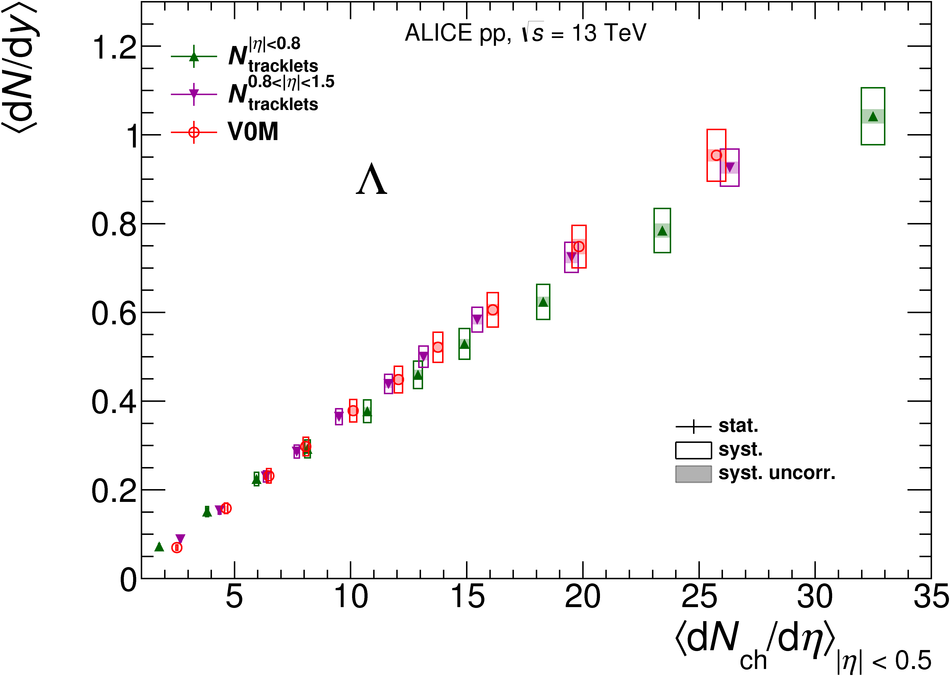 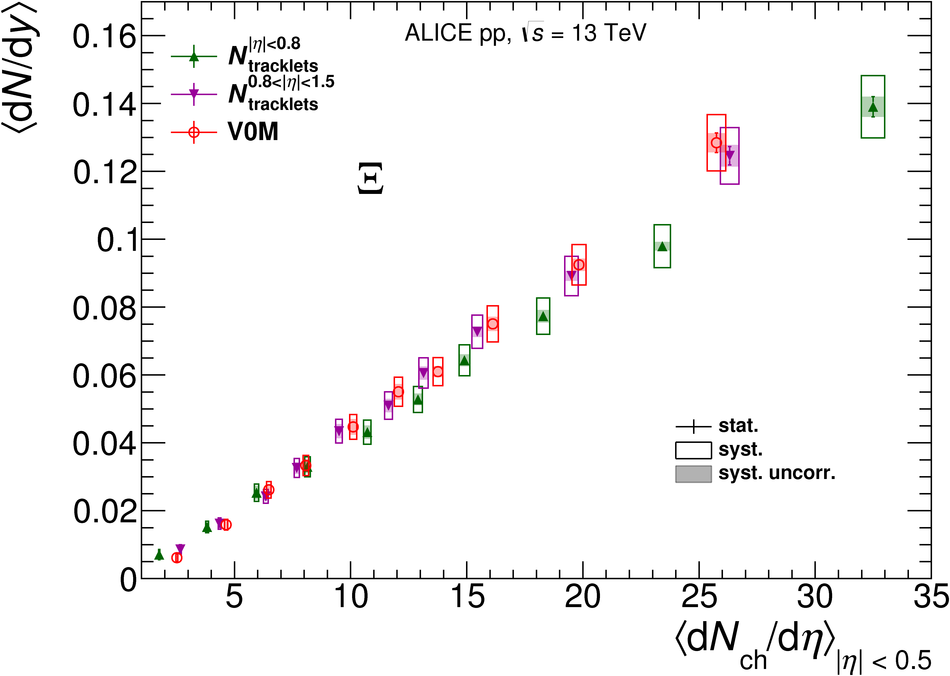  |
Figure 9
\dndy\ (integrated over the measured \pt\ ranges 0-12, 0.4-8, 0.6-6.5 and 0.9-5.5 \gevc\ for \pKzero, \pLambda, \pXi and \pOmega, respectively) as a function of multiplicity for different strange particle species reported for different multiplicity classes (see text for details) Error bars and boxes represent statistical and total systematic uncertainties, respectively. The bin-to-bin systematic uncertainties are shown by shadowed boxes. | 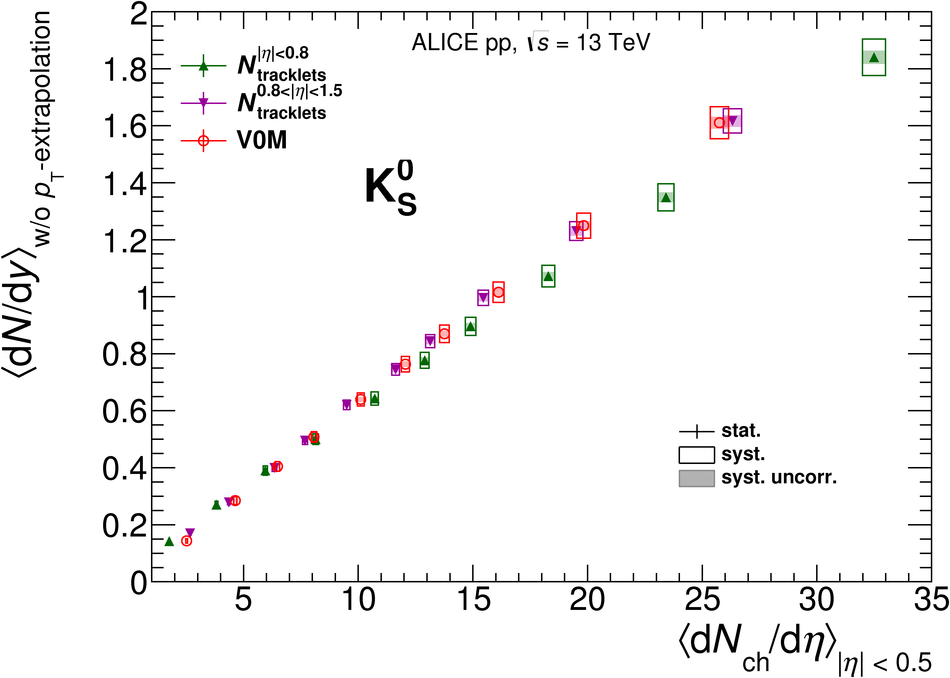 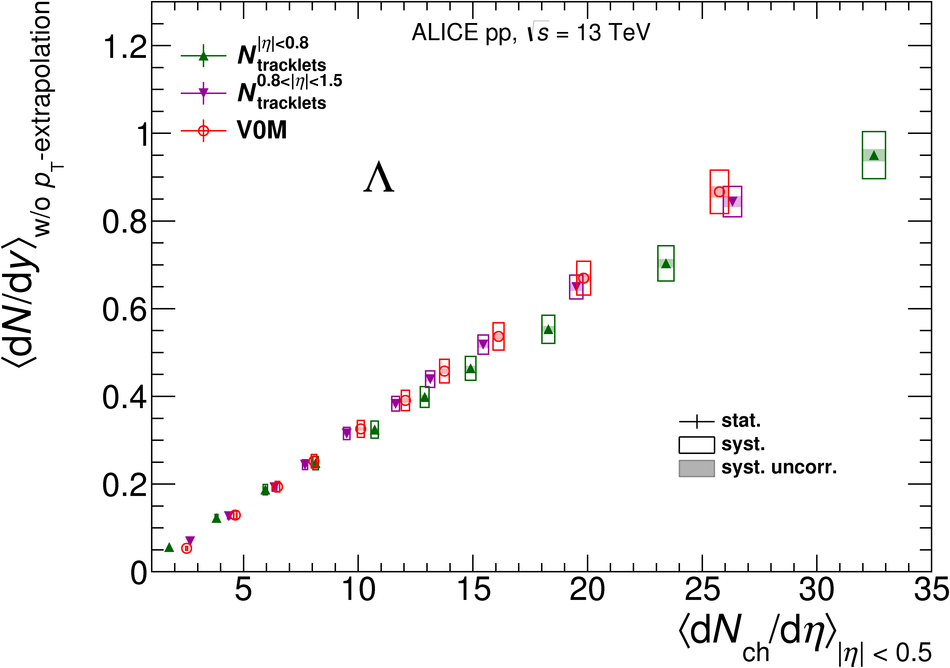 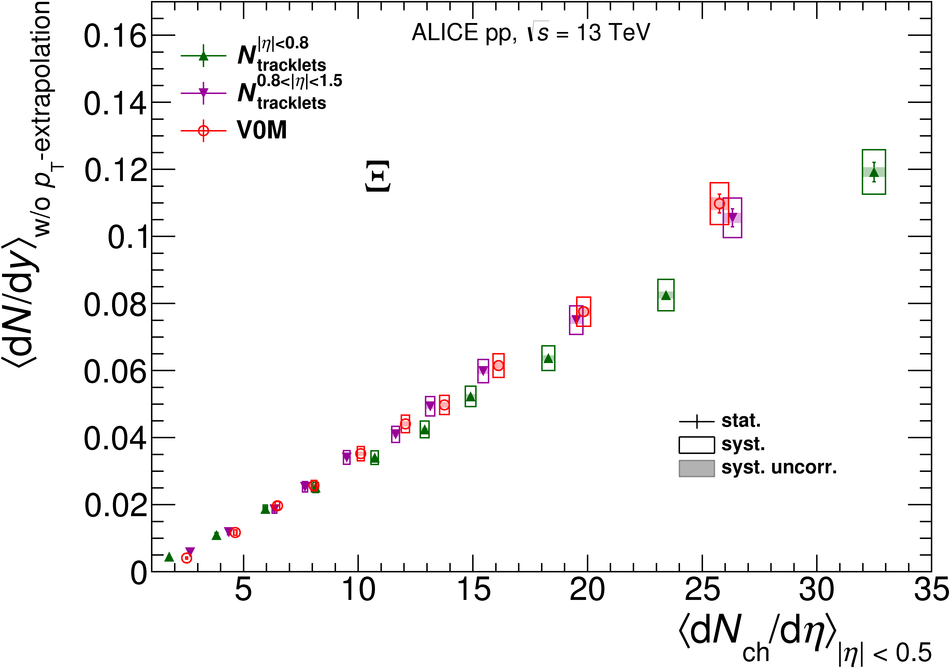 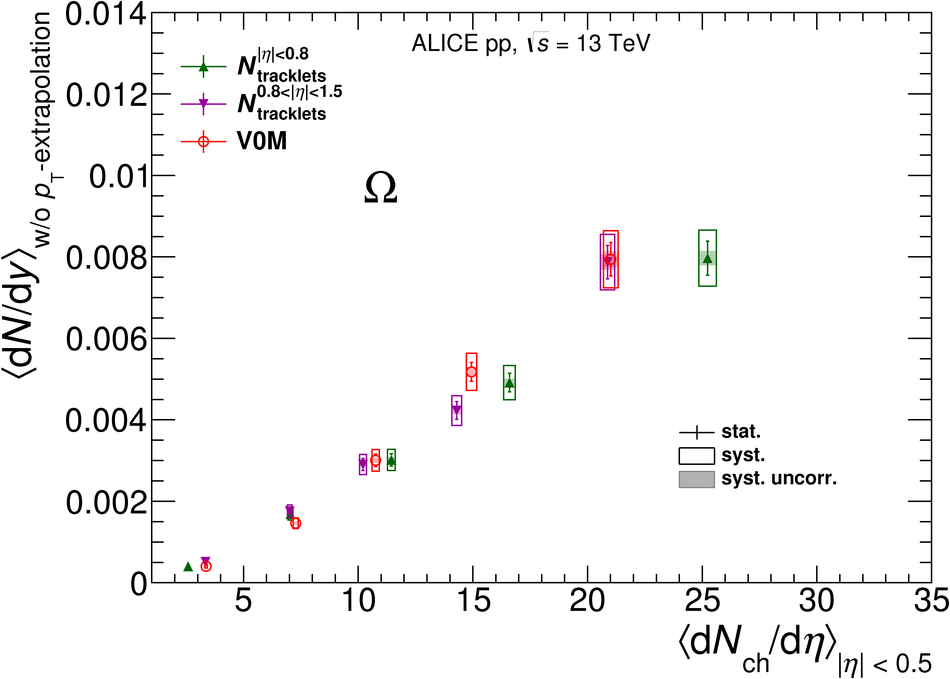 |
Figure 10
Correlations between integrated yield of different strange hadrons in multiplicity classes selected according to different estimators(see text for details). Statistical and systematic uncertainties are shown by error bars and empty boxes, respectively. Shadowed boxes represent uncertainties uncorrelated across multiplicity. | 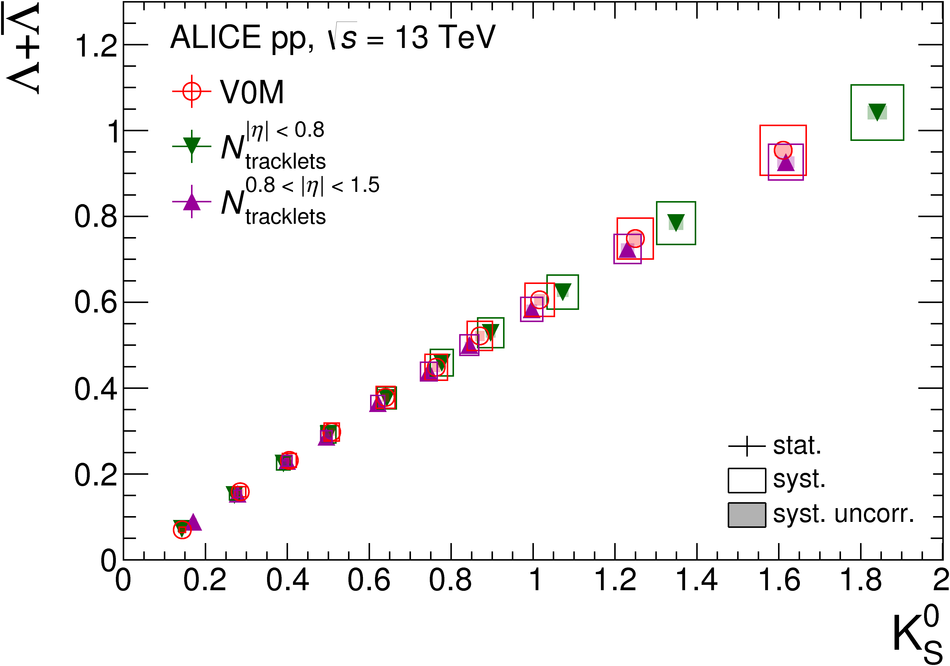 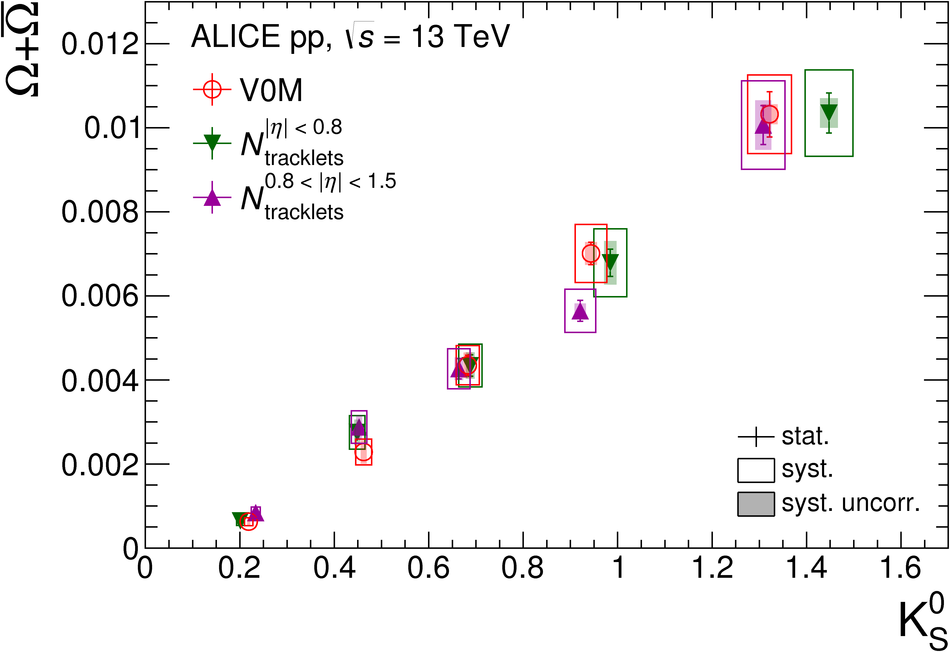 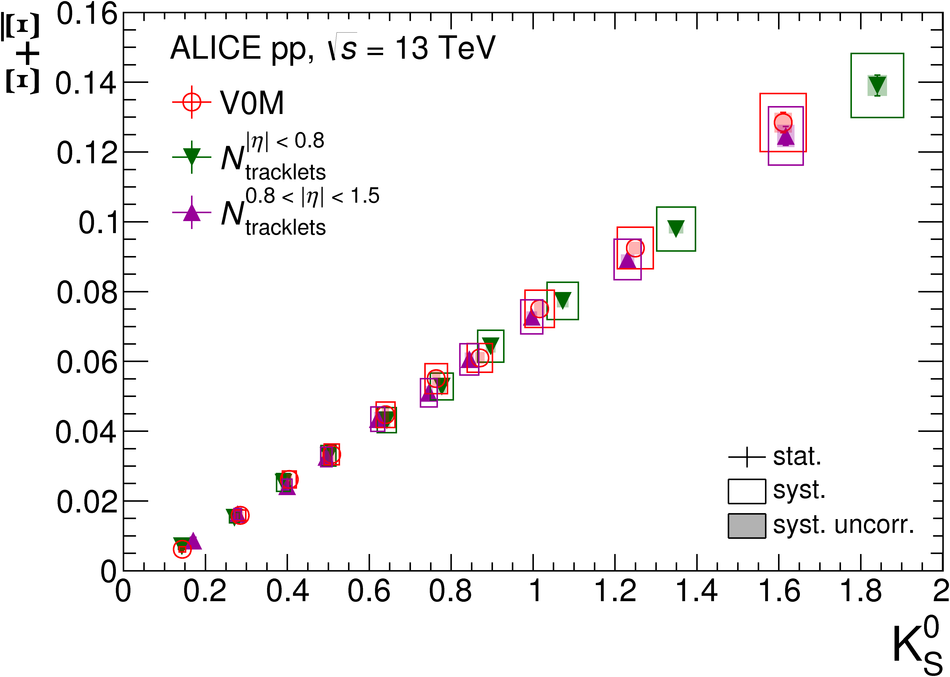 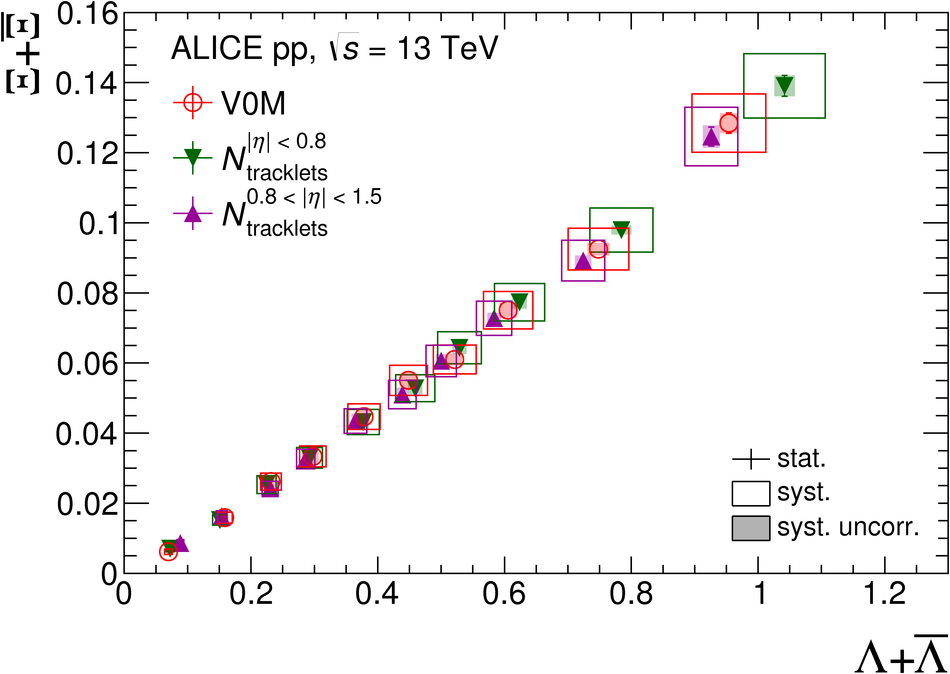 |
Figure 11
Integrated yields of \pKzero, \sLambda, \sXi, and \sOmega as a function of \dNdeta\ in V0M multiplicityevent classes at \s = 7 and 13 TeV. Statistical and systematic uncertainties are shown by error bars and empty boxes, respectively. Shadowed boxes represent uncertainties uncorrelated across multiplicity The corresponding results obtained for \inelgtzero\ event class are also shown. | 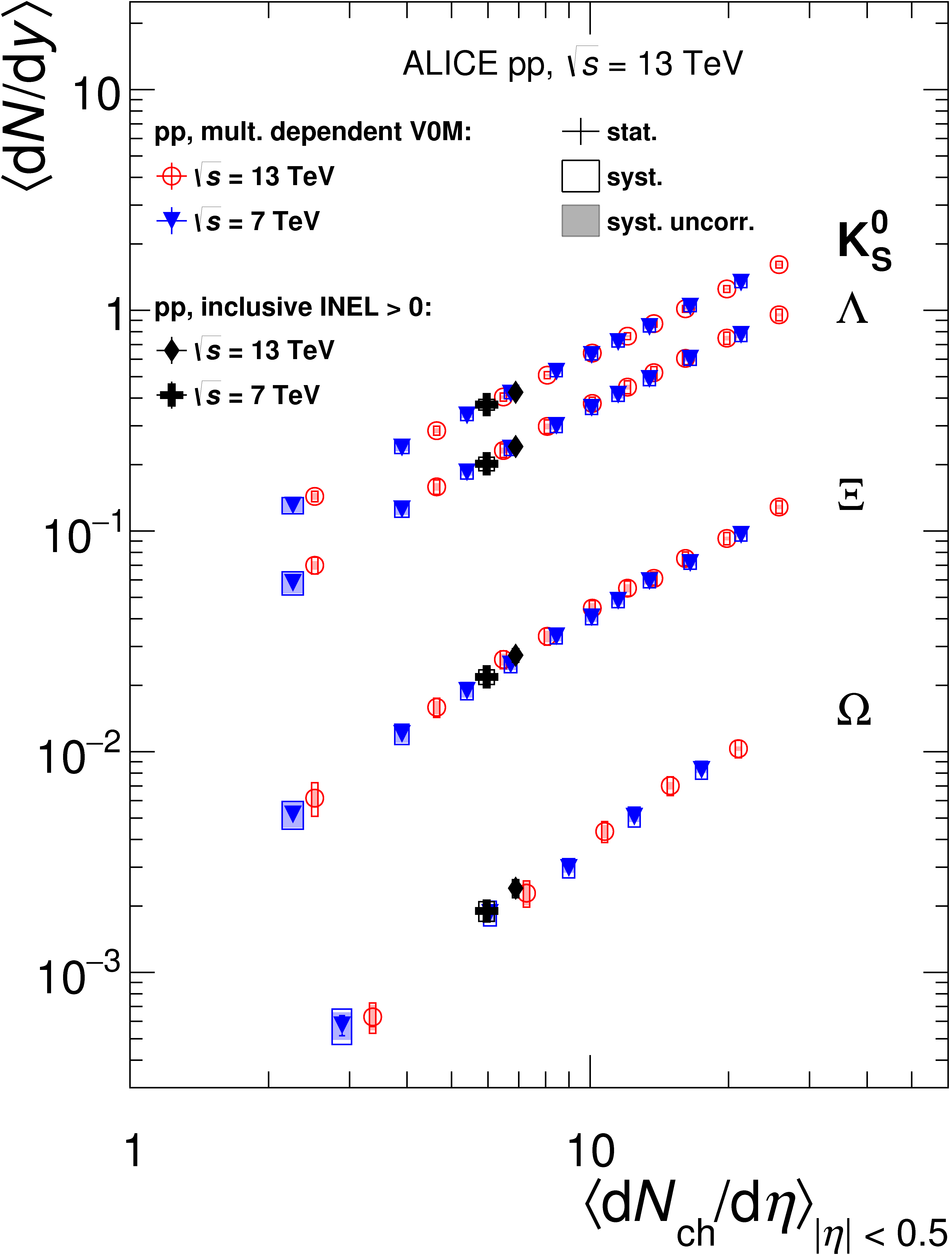 |
Figure 12
\avpT\ of \pKzero, \sLambda, \sXi, and \sOmega as a function of \dNdeta\ in V0M multiplicityevent classes at \s = 7 and 13 TeV. Statistical and systematic uncertainties are shown by error bars and empty boxes, respectively Shadowed boxes represent uncertainties uncorrelated across multiplicity. The results are compared to predictions from several Monte Carlo models. | 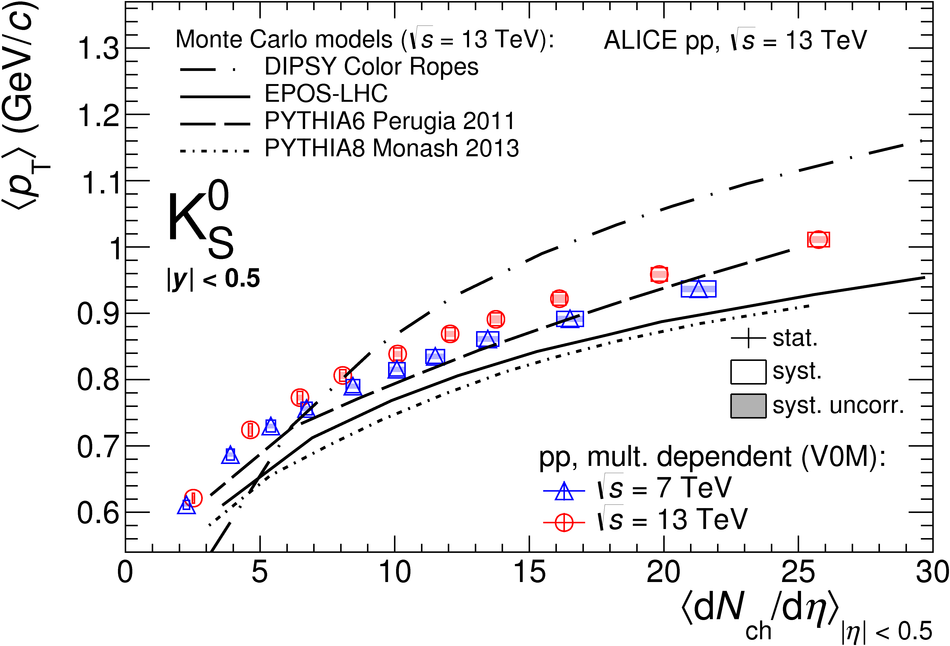 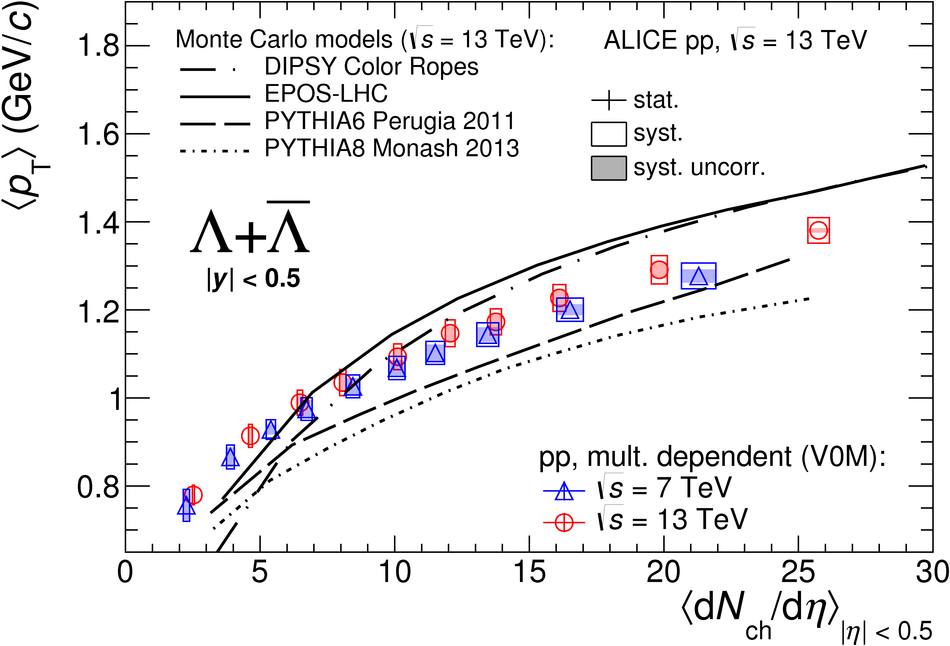 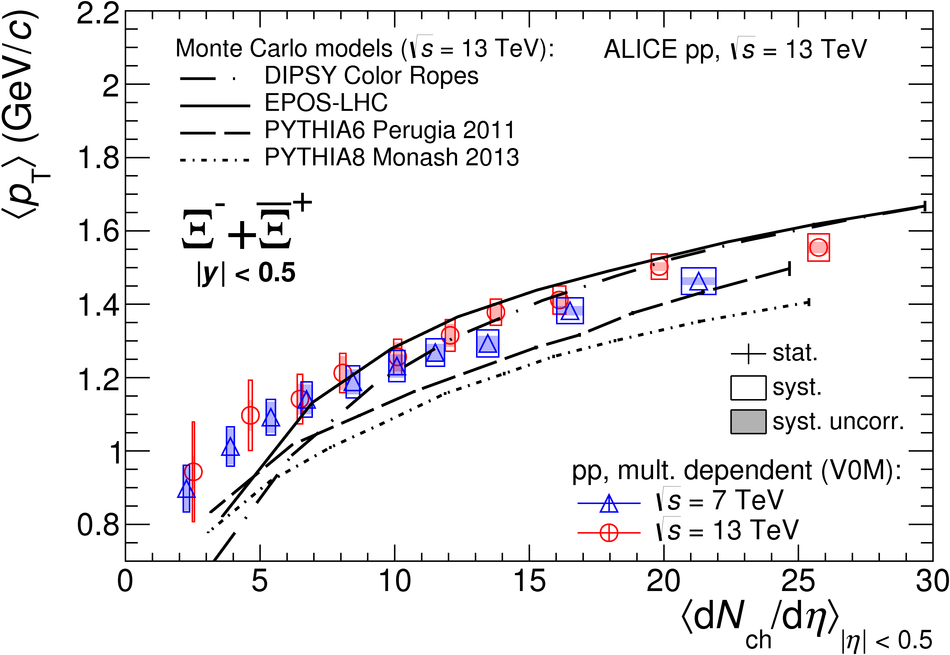 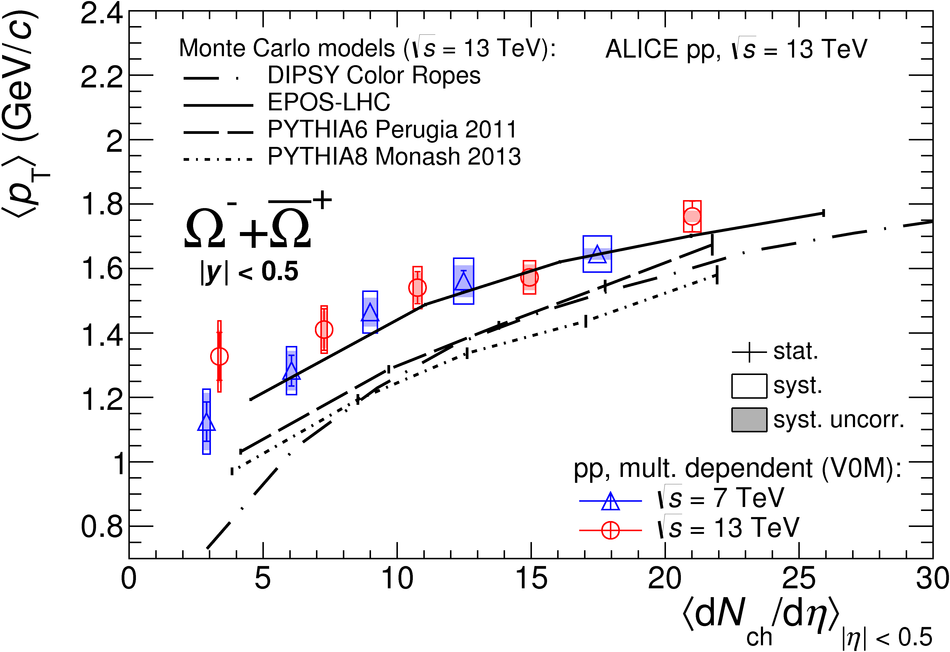 |
Figure 13
Ratios of integrated yields of \sLambda (no \apLambda contribution considered here), \sXi, and \sOmega\ to \pKzero\ as a function of \dNdeta\ for different multiplicityestimators (see text for details) in pp collisions at \s = 13 TeV. Statistical and systematic uncertainties are shown by error bars and empty boxes, respectively. Shadowed boxes represent uncertainties uncorrelated across multiplicity. The corresponding calculations from grand-canonical thermal models, which refer to most central Pb-Pb collisions at $\sqrt{s_{\rm NN}} = 2.76$ TeV, are shown. | 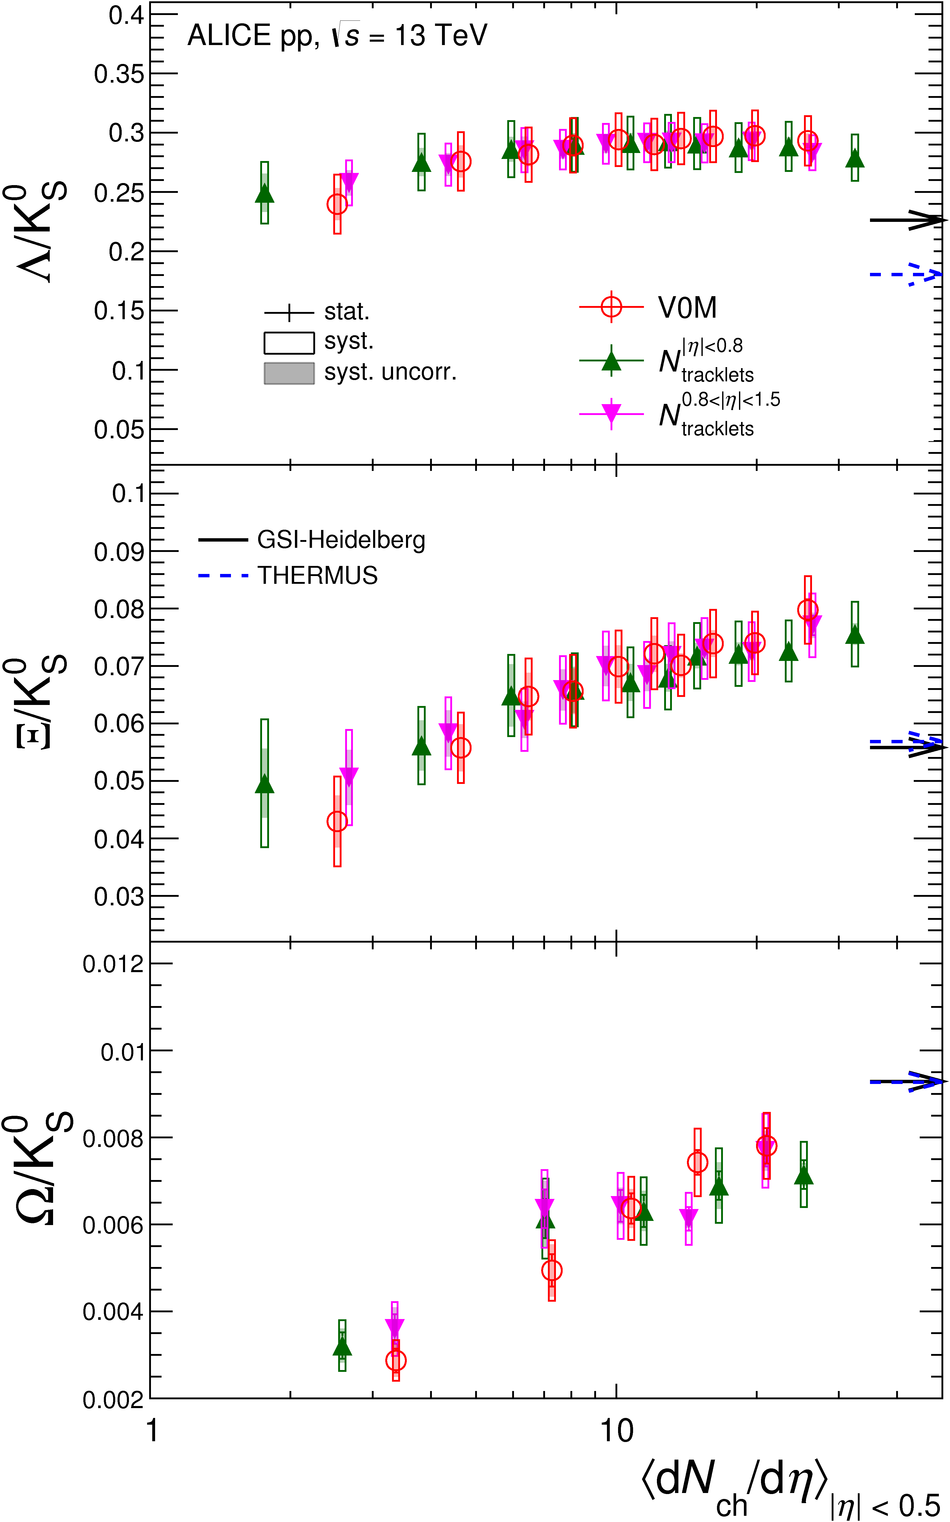 |
Figure 14
Integrated yields of \pKzero, \sLambda, \sXi, and \sOmega as a function of \dNdeta\ in V0M multiplicityevent classes at \s = 7 and 13 TeV. Statistical and systematic uncertainties are shown by error bars and empty boxes, respectively Shadowed boxes represent uncertainties uncorrelated across multiplicity. The results are compared to predictions from several Monte Carlo models. | 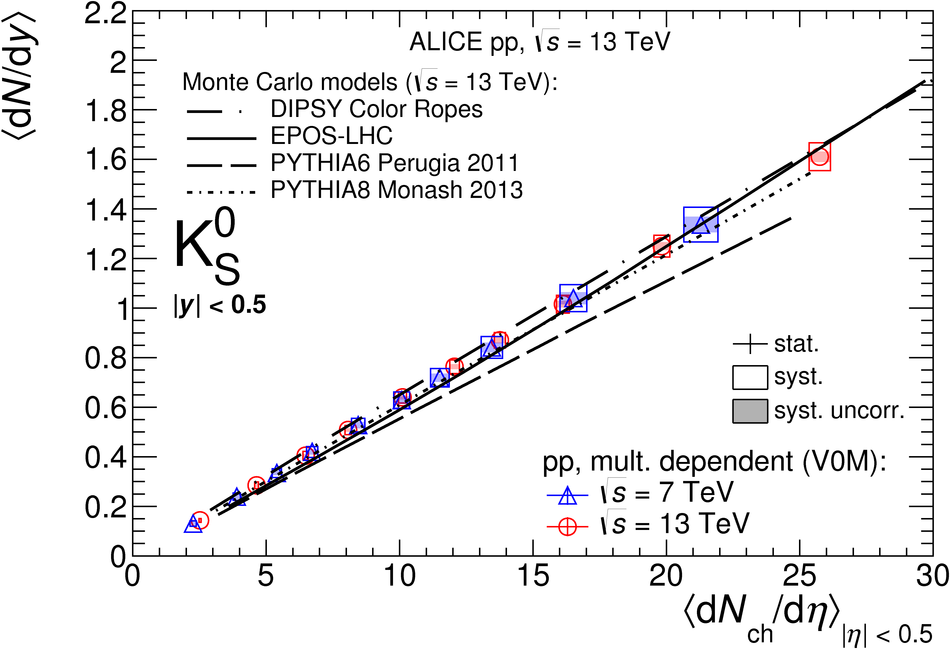 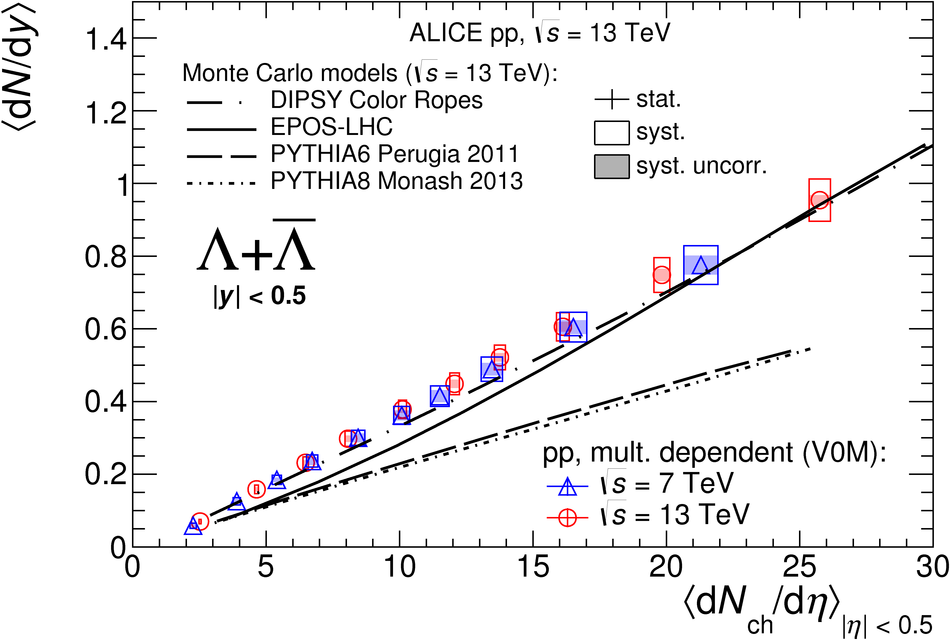 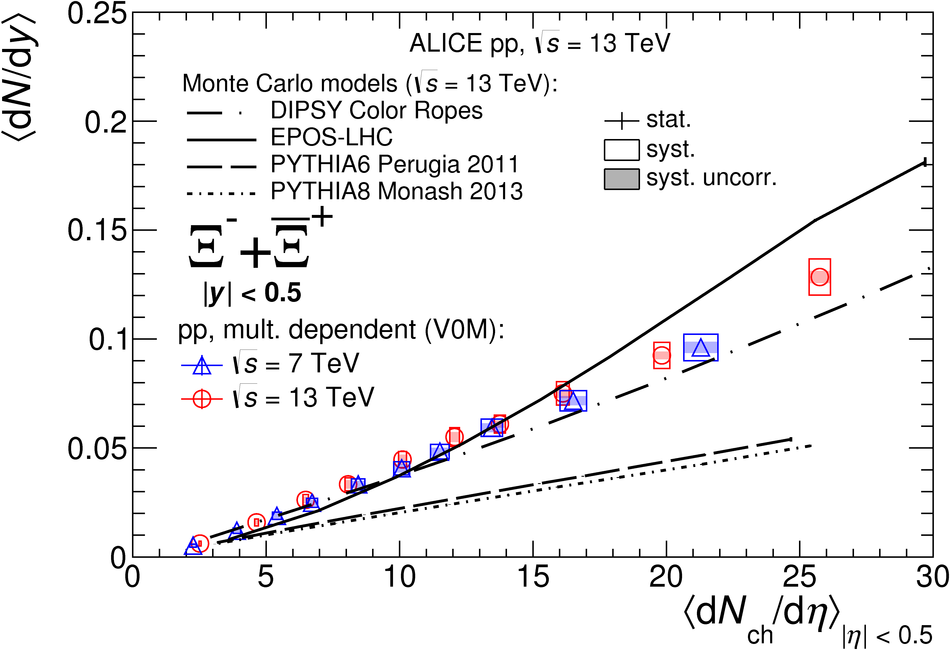 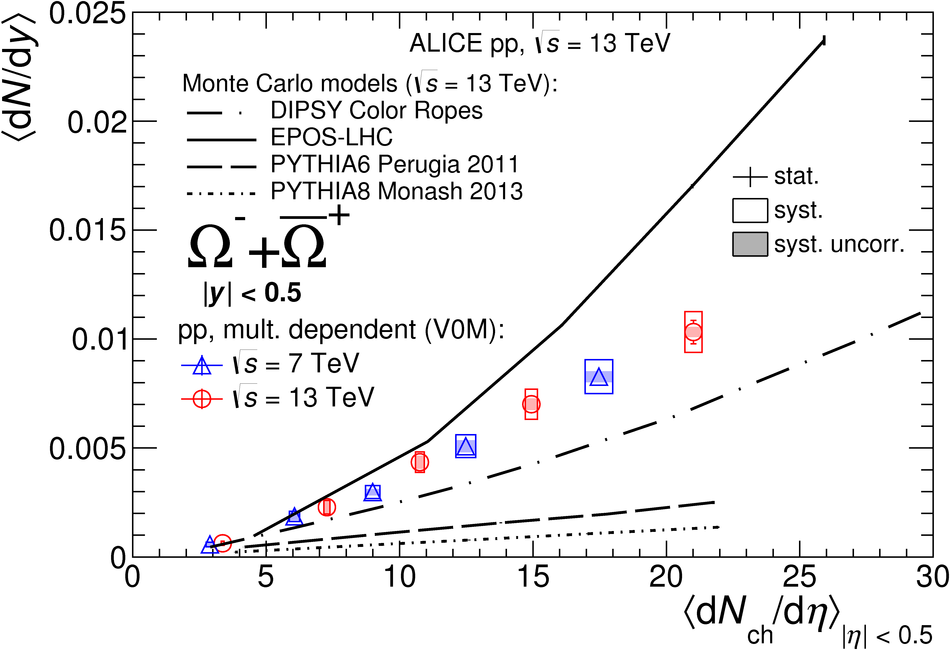 |