An improved value for the lifetime of the (anti-)hypertriton has been obtained using the data sample of Pb-Pb collisions at $\sqrt{s_{\mathrm{NN}}} = $ 5.02 TeV collected by the ALICE experiment at the LHC. The (anti-)hypertriton has been reconstructed via its charged two-body mesonic decay channel and the lifetime has been determined from an exponential fit to the d$N$/d($ct$) spectrum. The measured value, $\tau$ = 242$^{+34}_{-38}$ (stat.) $\pm$ 17 (syst.) ps, is compatible with all the available theoretical predictions, thus contributing to the solution of the longstanding hypertriton lifetime puzzle.
Phys.Lett. B797 (2019) 134905
HEP Data
e-Print: arXiv:1907.06906 | PDF | inSPIRE
Figure 1
Invariant mass distribution of (\elio, $\pi^-$) and (\antielio, $\pi^+$) for the four $ct$ intervals used to determine the \hyptriton and \antihyptriton lifetime. The solid blue curve represents the function used to perform the fit and the red dashed curve represents the background component. | 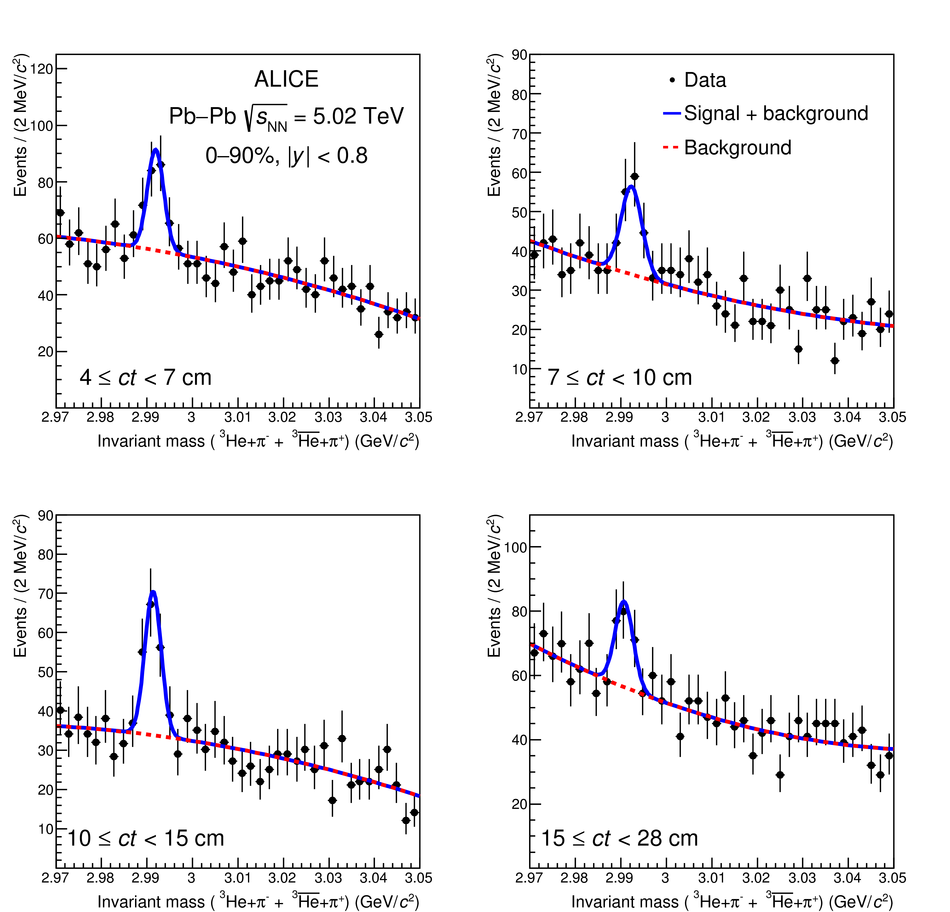 |
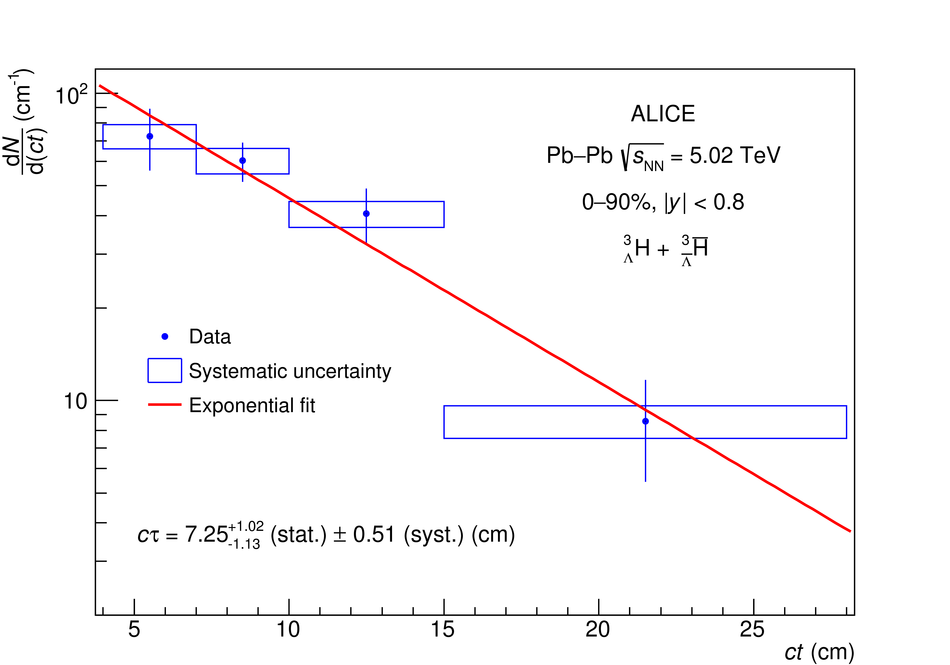
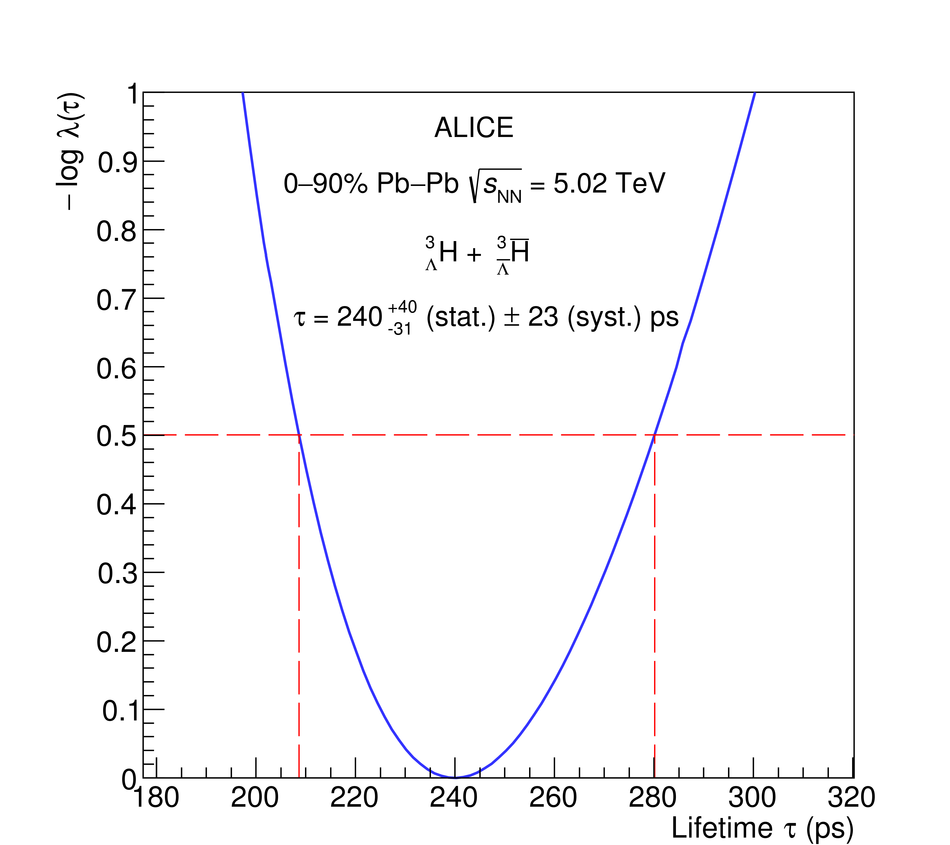
Figure 5
Collection of the \hyptriton lifetime measurements obtained with different experimental techniques. The vertical lines and boxes are the statistical and systematic uncertainties respectively. The orange band represents the average of the lifetime values and the lines at the edge correspond to 1$\sigma$ uncertainty. The dashed-dotted lines are four theoretical predictions. | 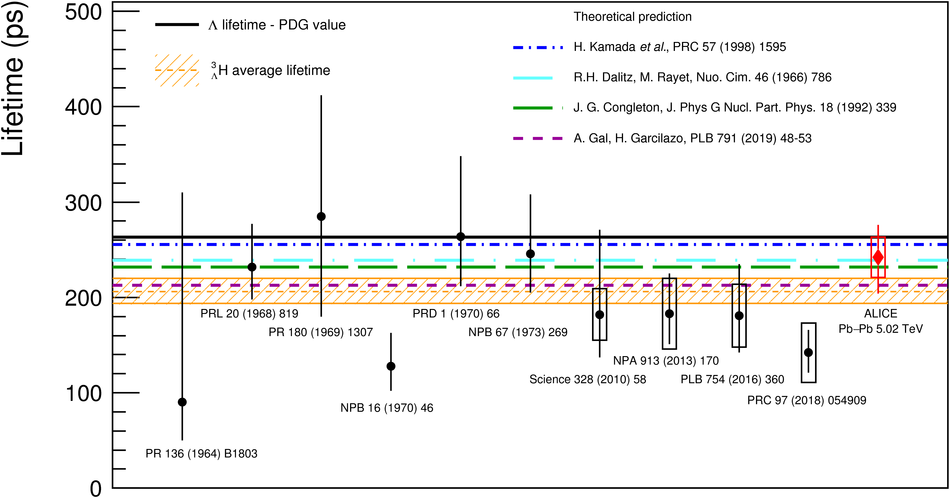 |