Invariant-mass (mass-difference) distributions of $\Dzero$, $\Dplus$, $\Dstar$, and $\Ds$ candidates and charge conjugates in $1.5< \pt< 2 \gevc$, $16< \pt< 24 \gevc$, $7< \pt< 7.5 \gevc$, and $3< \pt< 4 \gevc$ intervals, respectively. The blue solid lines show the total fit functions as described in the text and the red dashed lines are the combinatorial-background terms. In case of $\Dzero$, the grey dashed line represents the combinatorial background with the contribution of the reflections. The values of the mean ($\mu$) and the width ($\sigma$) of the signal peak are reported together with the signal counts ($S$) and the signal over background ratio ($S/B$) in the mass interval ($\mu-3\sigma,\mu+3\sigma$). The reported uncertainties are only the statistical uncertainties from the fit. |   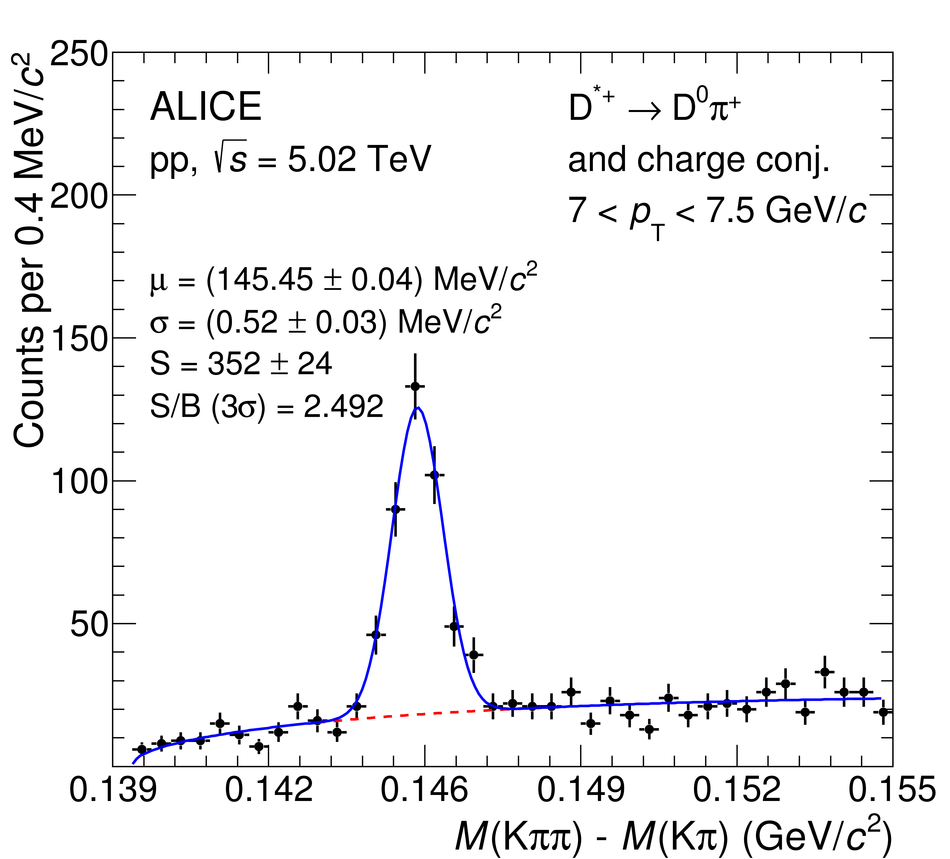 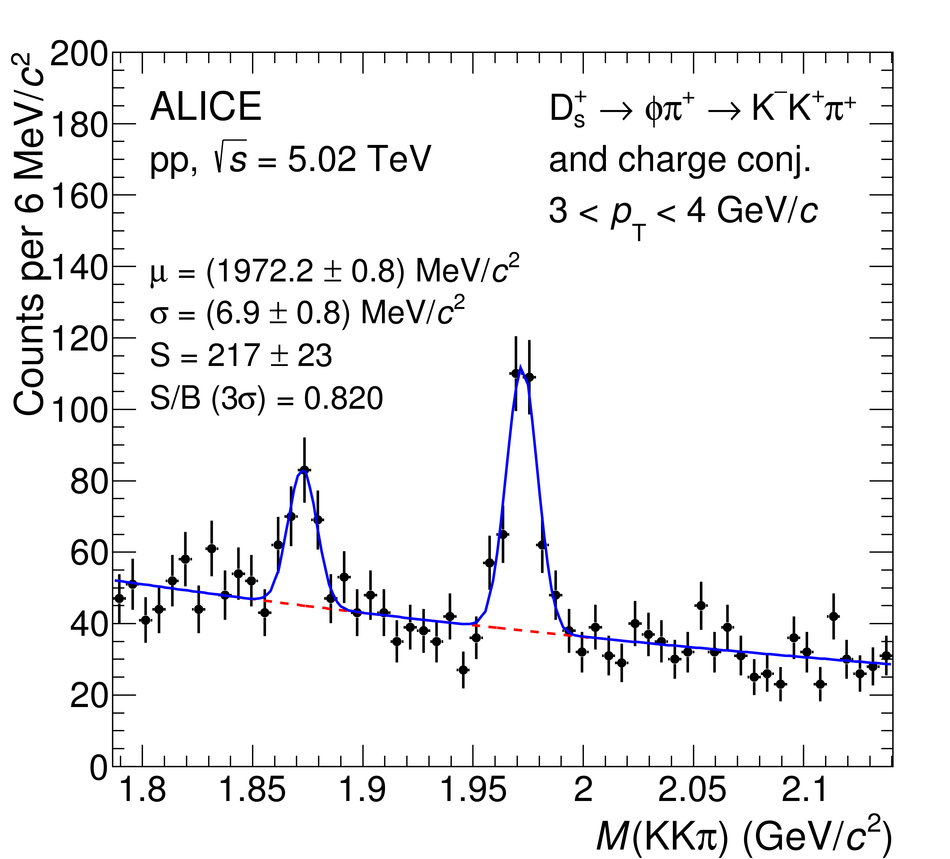 |