Inclusive $\upsis$ $\raa$ as a function of centrality (top), $\pt$ (left) and $y$ (right) at forward rapidity at $\snn=5.02$ TeV. ALICE results at $\snn=2.76$ TeV as a function of centrality and $y$ are shown for comparison . The vertical error bars and the boxes represent the statistical and uncorrelated systematic uncertainties, respectively. The relative correlated uncertainty is shown as boxes at unity. ALICE $\upsis$ $\raa$ measurements at $\snn=5.02$ TeV are compared to predictions from two transport models and one hydro-dynamical model as a function of centrality (top), $\pt$ (left) and $y$ (right). See text for details on the models. | 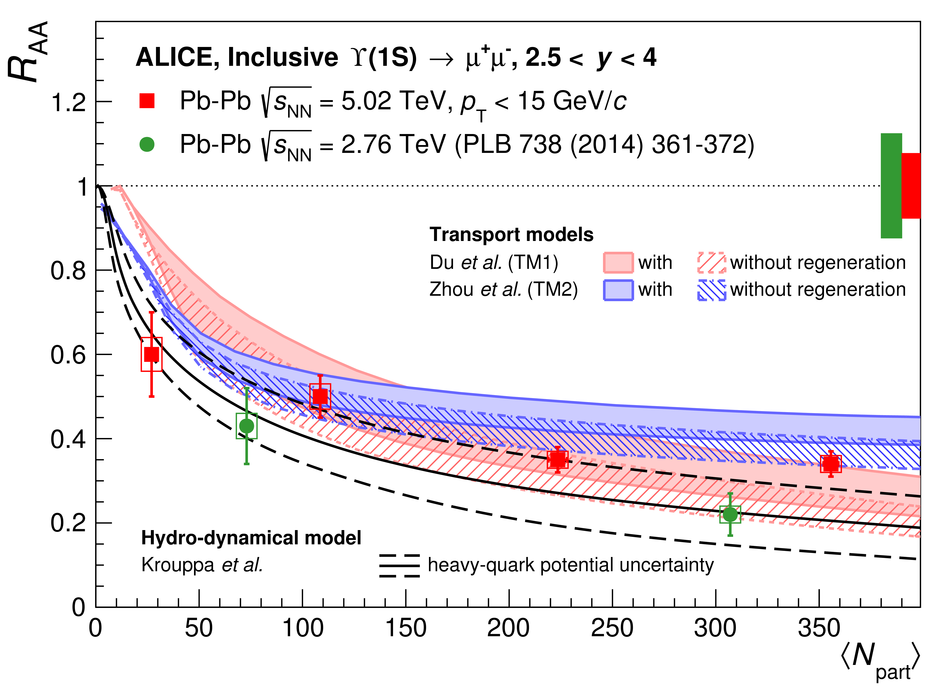 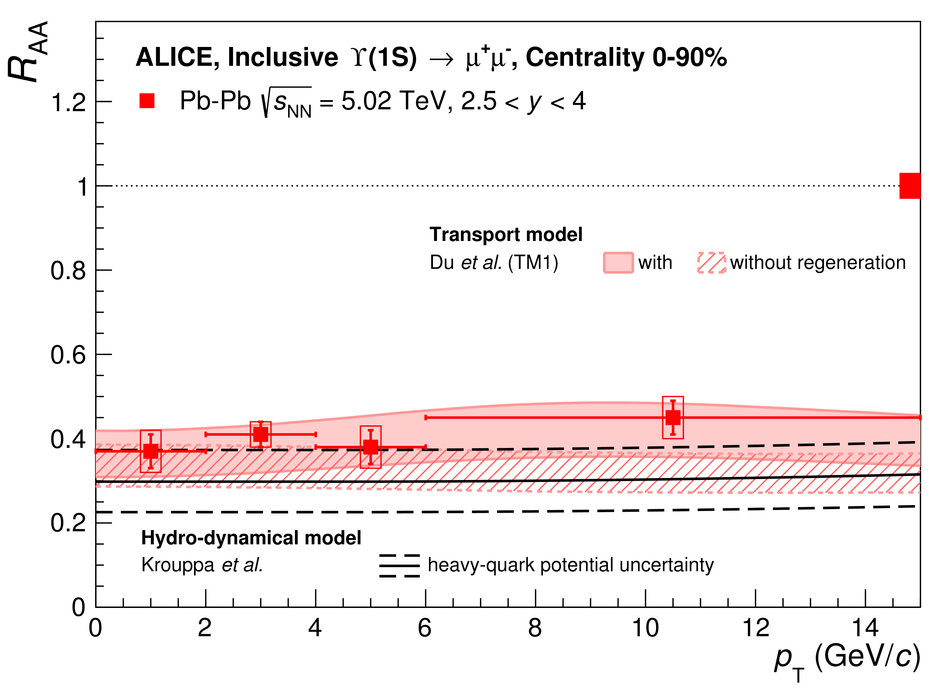 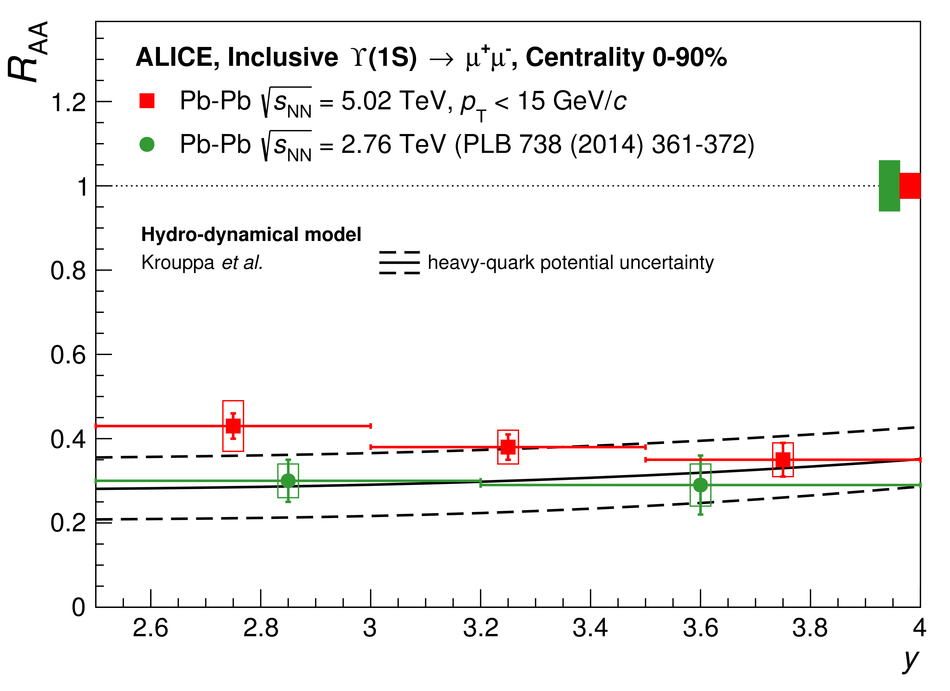 |