We present the first measurement of event-by-event fluctuations in the kaon sector in Pb-Pb collisions at $\sqrt {s_{\rm NN}}=$ 2.76 TeV with the ALICE detector at the LHC. The robust fluctuation correlator $\nu_{\rm dyn}$ is used to evaluate the magnitude of fluctuations of the relative yields of neutral and charged kaons, as well as the relative yields of charged kaons, as a function of collision centrality and selected kinematic ranges. While the correlator $\nu_{\rm dyn}[\rm K^+,\rm K^-]$ exhibits a scaling approximately in inverse proportion of the charged particle multiplicity, $\nu_{\rm dyn}[\rm K_S^0,\rm K^{\pm}]$ features a significant deviation from such scaling. Within uncertainties, the value of $\nu_{\rm dyn}[\rm K_S^0,\rm K^{\pm}]$ is independent of the selected transverse momentum interval, while it exhibits a pseudorapidity dependence. The results are compared with HIJING, AMPT and EPOS-LHC predictions, and are further discussed in the context of the possible production of disoriented chiral condensates in central Pb-Pb collisions.
Phys. Lett. B 832 (2022) 137242
HEP Data
e-Print: arXiv:2112.09482 | PDF | inSPIRE
CERN-EP-2021-261
Figure group
Figure 1
Invariant mass distribution of $\pi^++\pi^-$ pairs measured in central (0--5$\%$) \PbPb\ collisions. The yellow and black solid lines show a second order polynomial fit of the combinatorial background and a Gaussian+second order polynomial fit to the invariant mass spectrum, respectively. The vertical dash lines delineate the mass range used for the determination of neutral-kaon yields. Given the red-brown area, which corresponds to combinatorial background, cannot be properly assessed event by event, the average of the yellow areas is used as proxy, event-by-event, to estimate the true combinatorial yield represented by the red-brown area. | 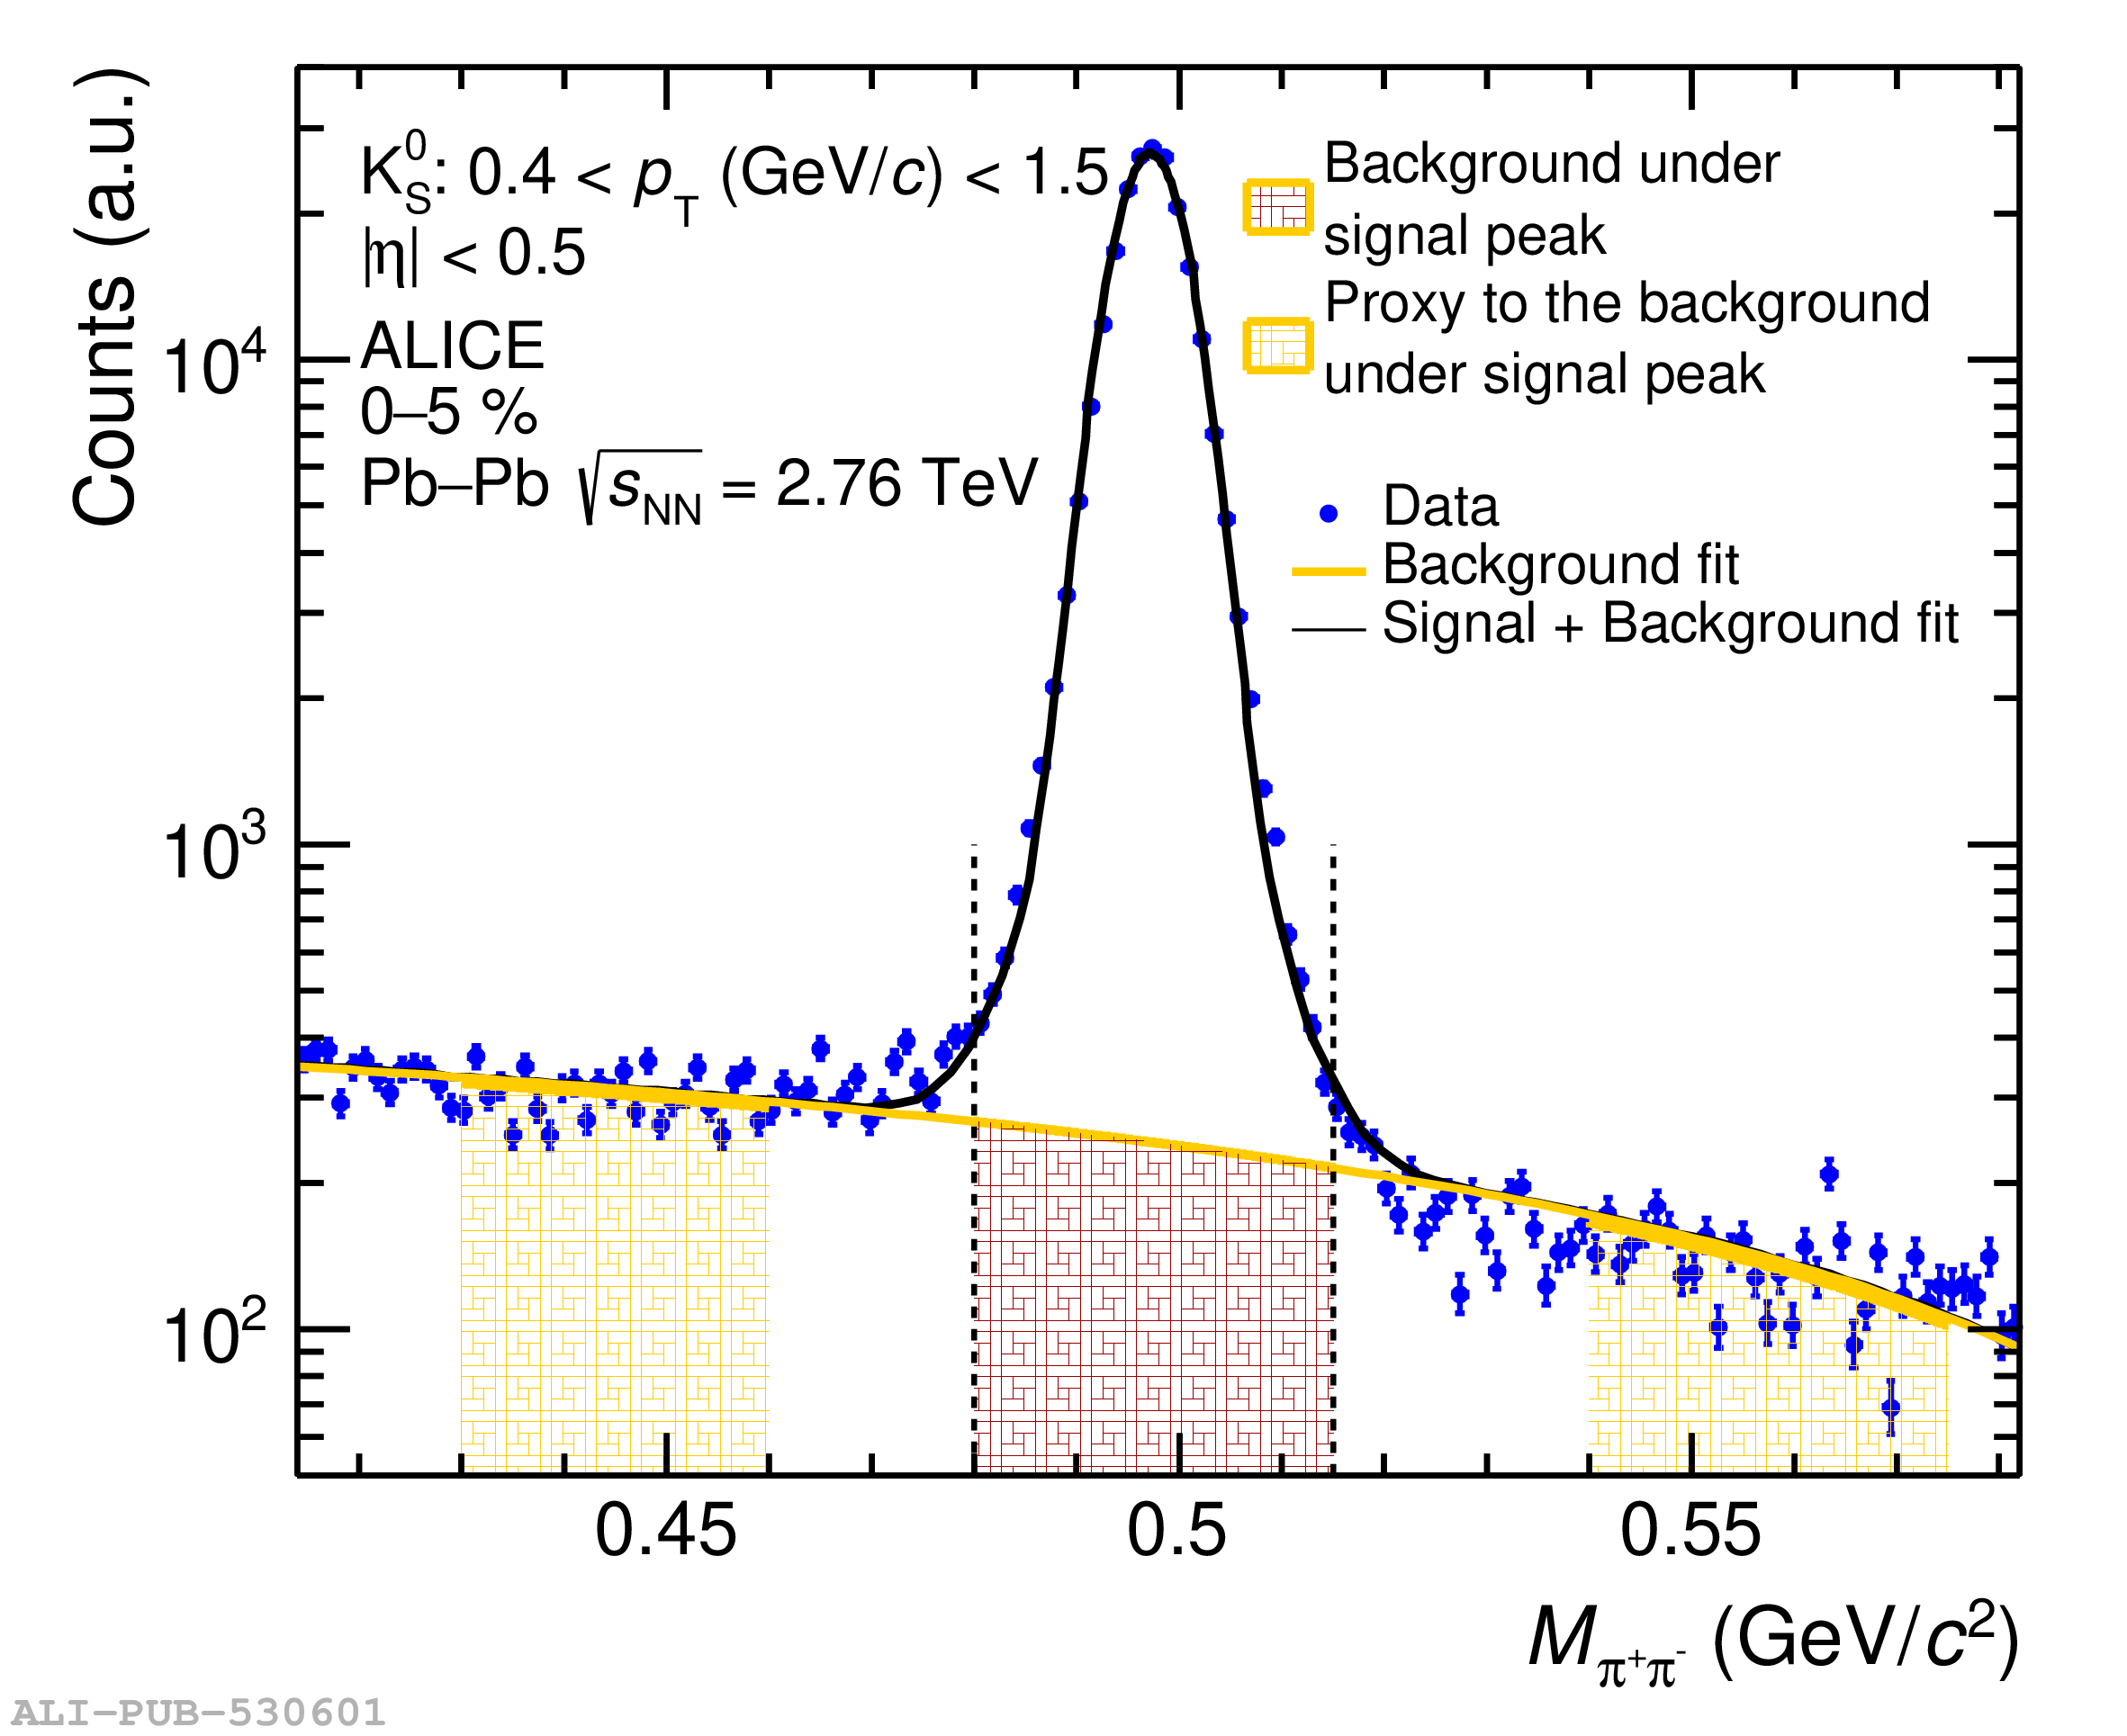 |
Figure 2
(a) Measured values of $\nu_{\rm dyn}[\rm K_{\rm S}^{0},\rm K^{\pm}]$ (top) and $\nu_{\rm dyn}[\rm K^{+},\rm K^{-}]$ (bottom) compared with HIJING and AMPT model calculations of these observables at generator level. (b) Values of $\nu_{\rm dyn}[\rm K_{\rm S}^{0},\rm K^{\pm}]$ (top) and $\nu_{\rm dyn}[\rm K^{+},\rm K^{-}]$ (bottom) scaled by $\alpha \equiv (\la \rm K_{\rm S}^{0}\ra^{-1} + \la\rm K^{\pm}\ra^{-1})$. Statistical and systematic uncertainties are represented as vertical bar and boxes, respectively. | 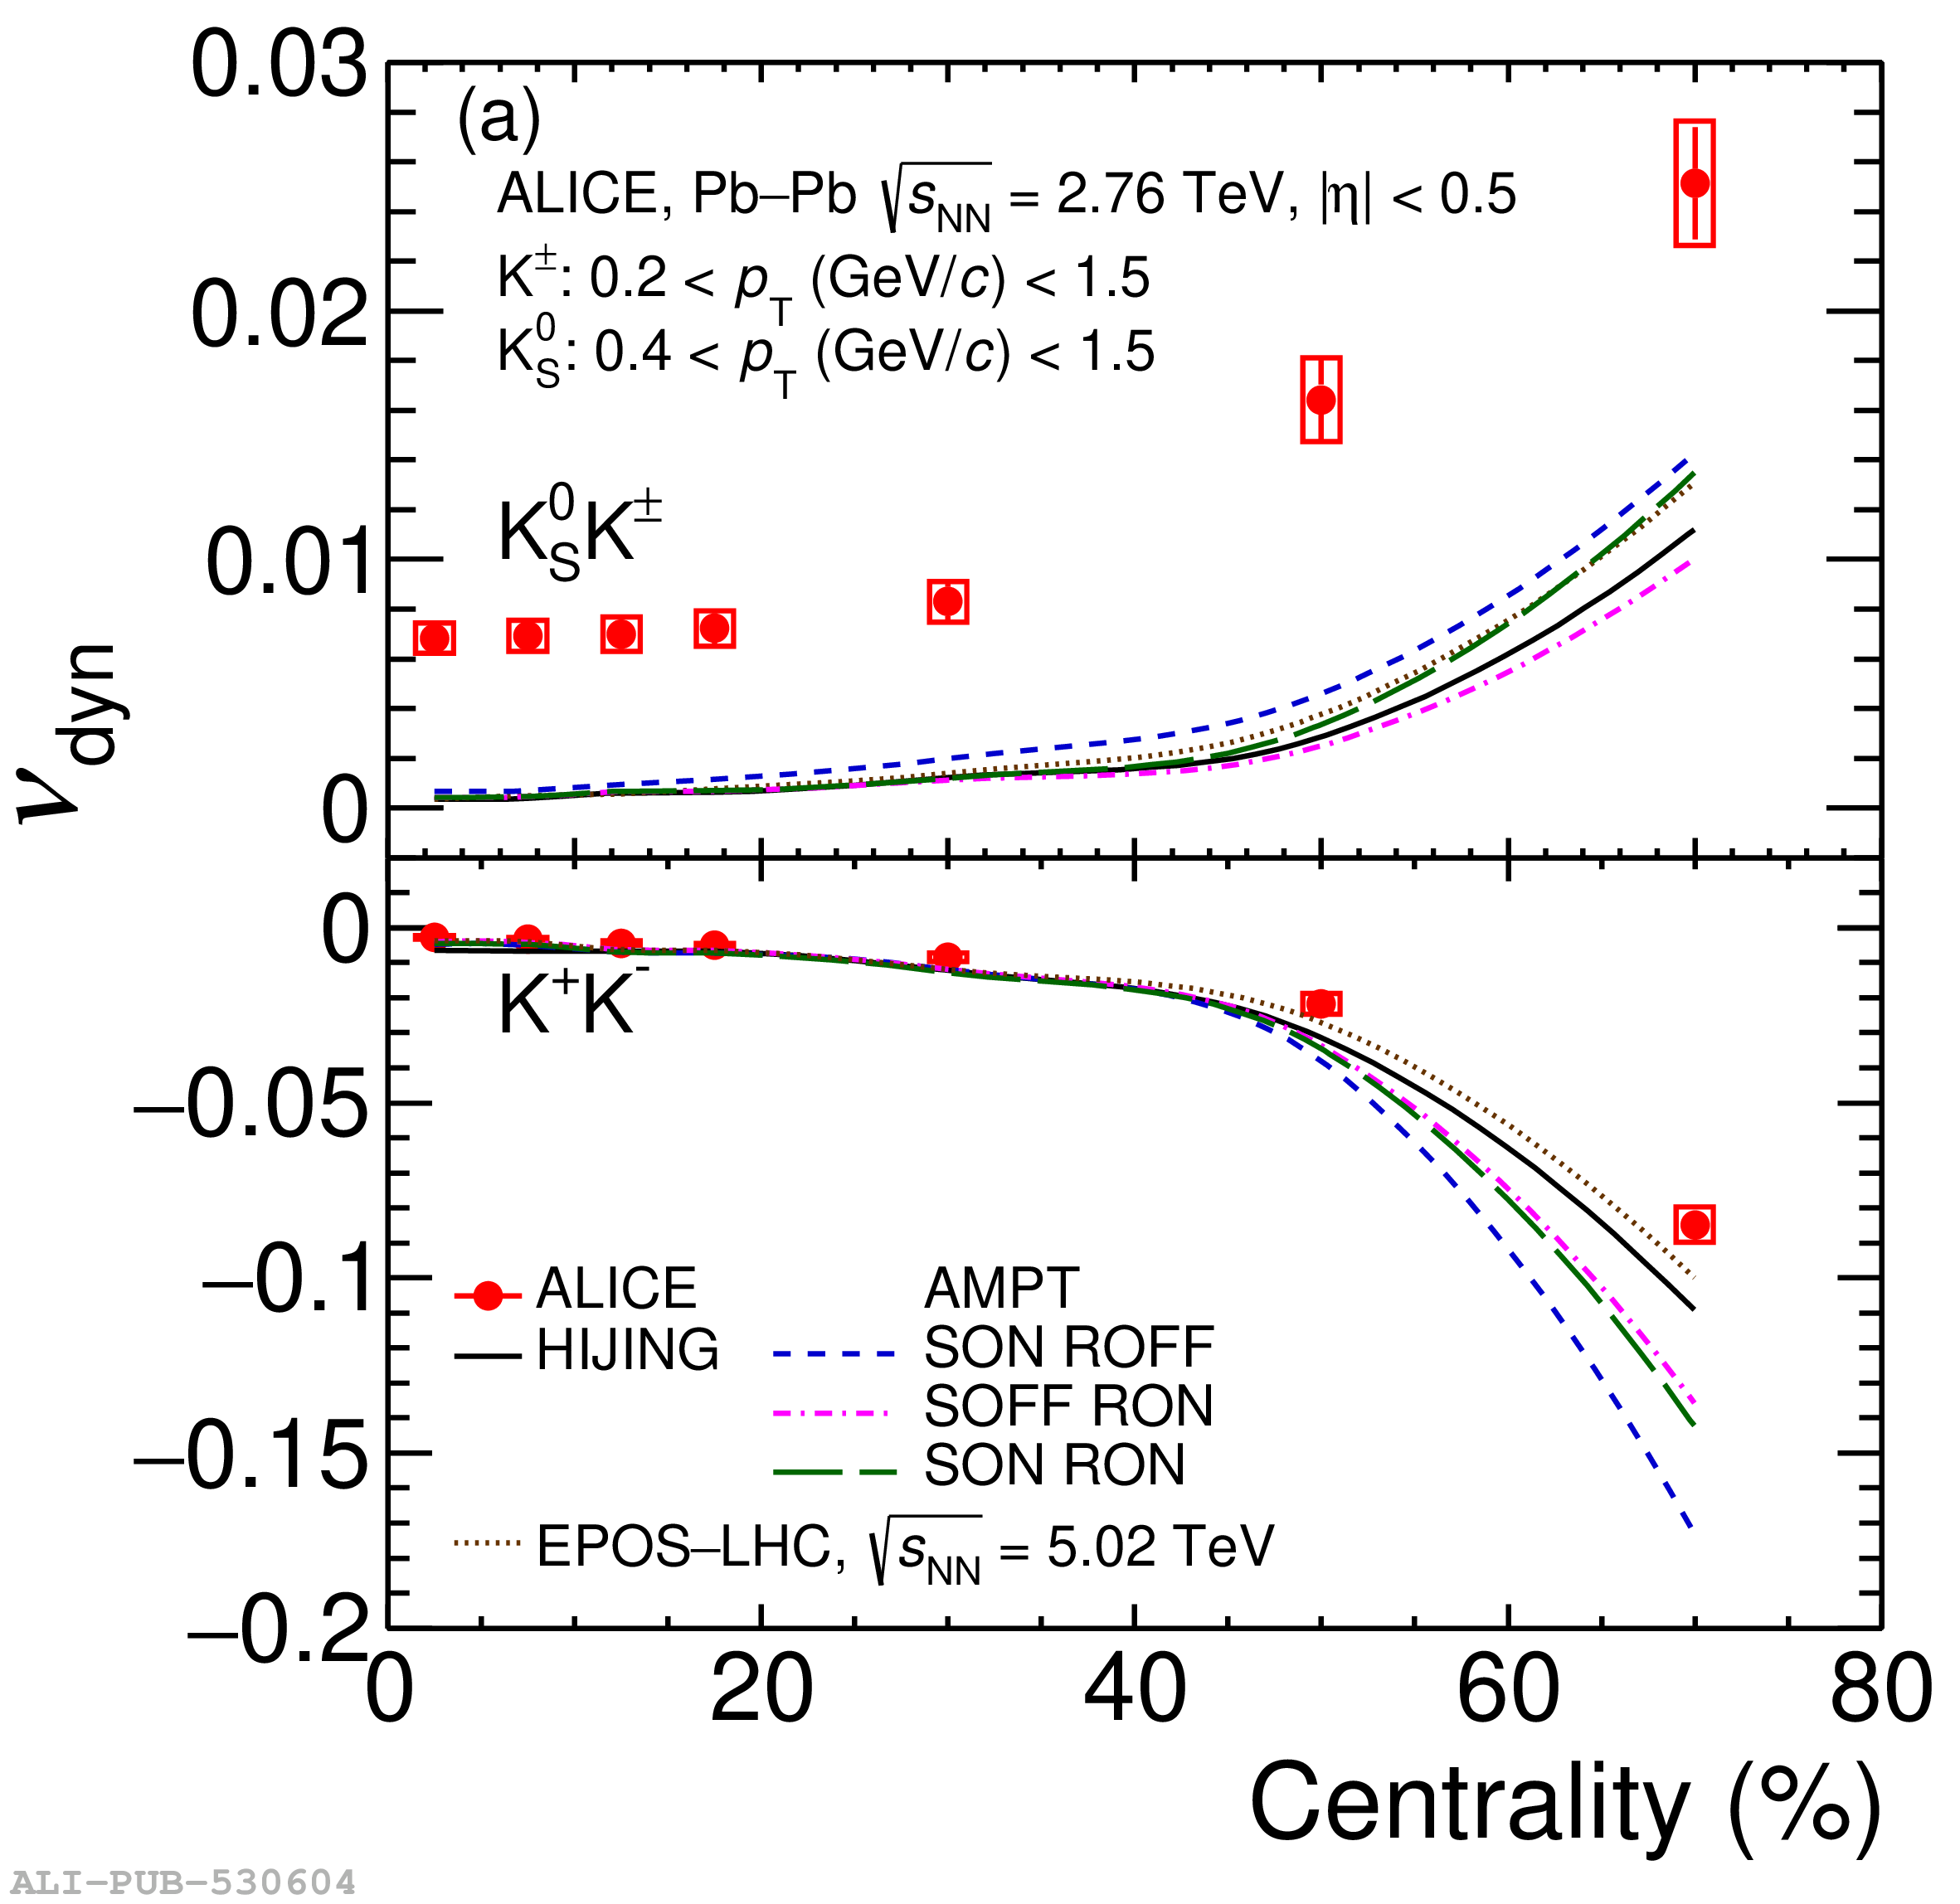 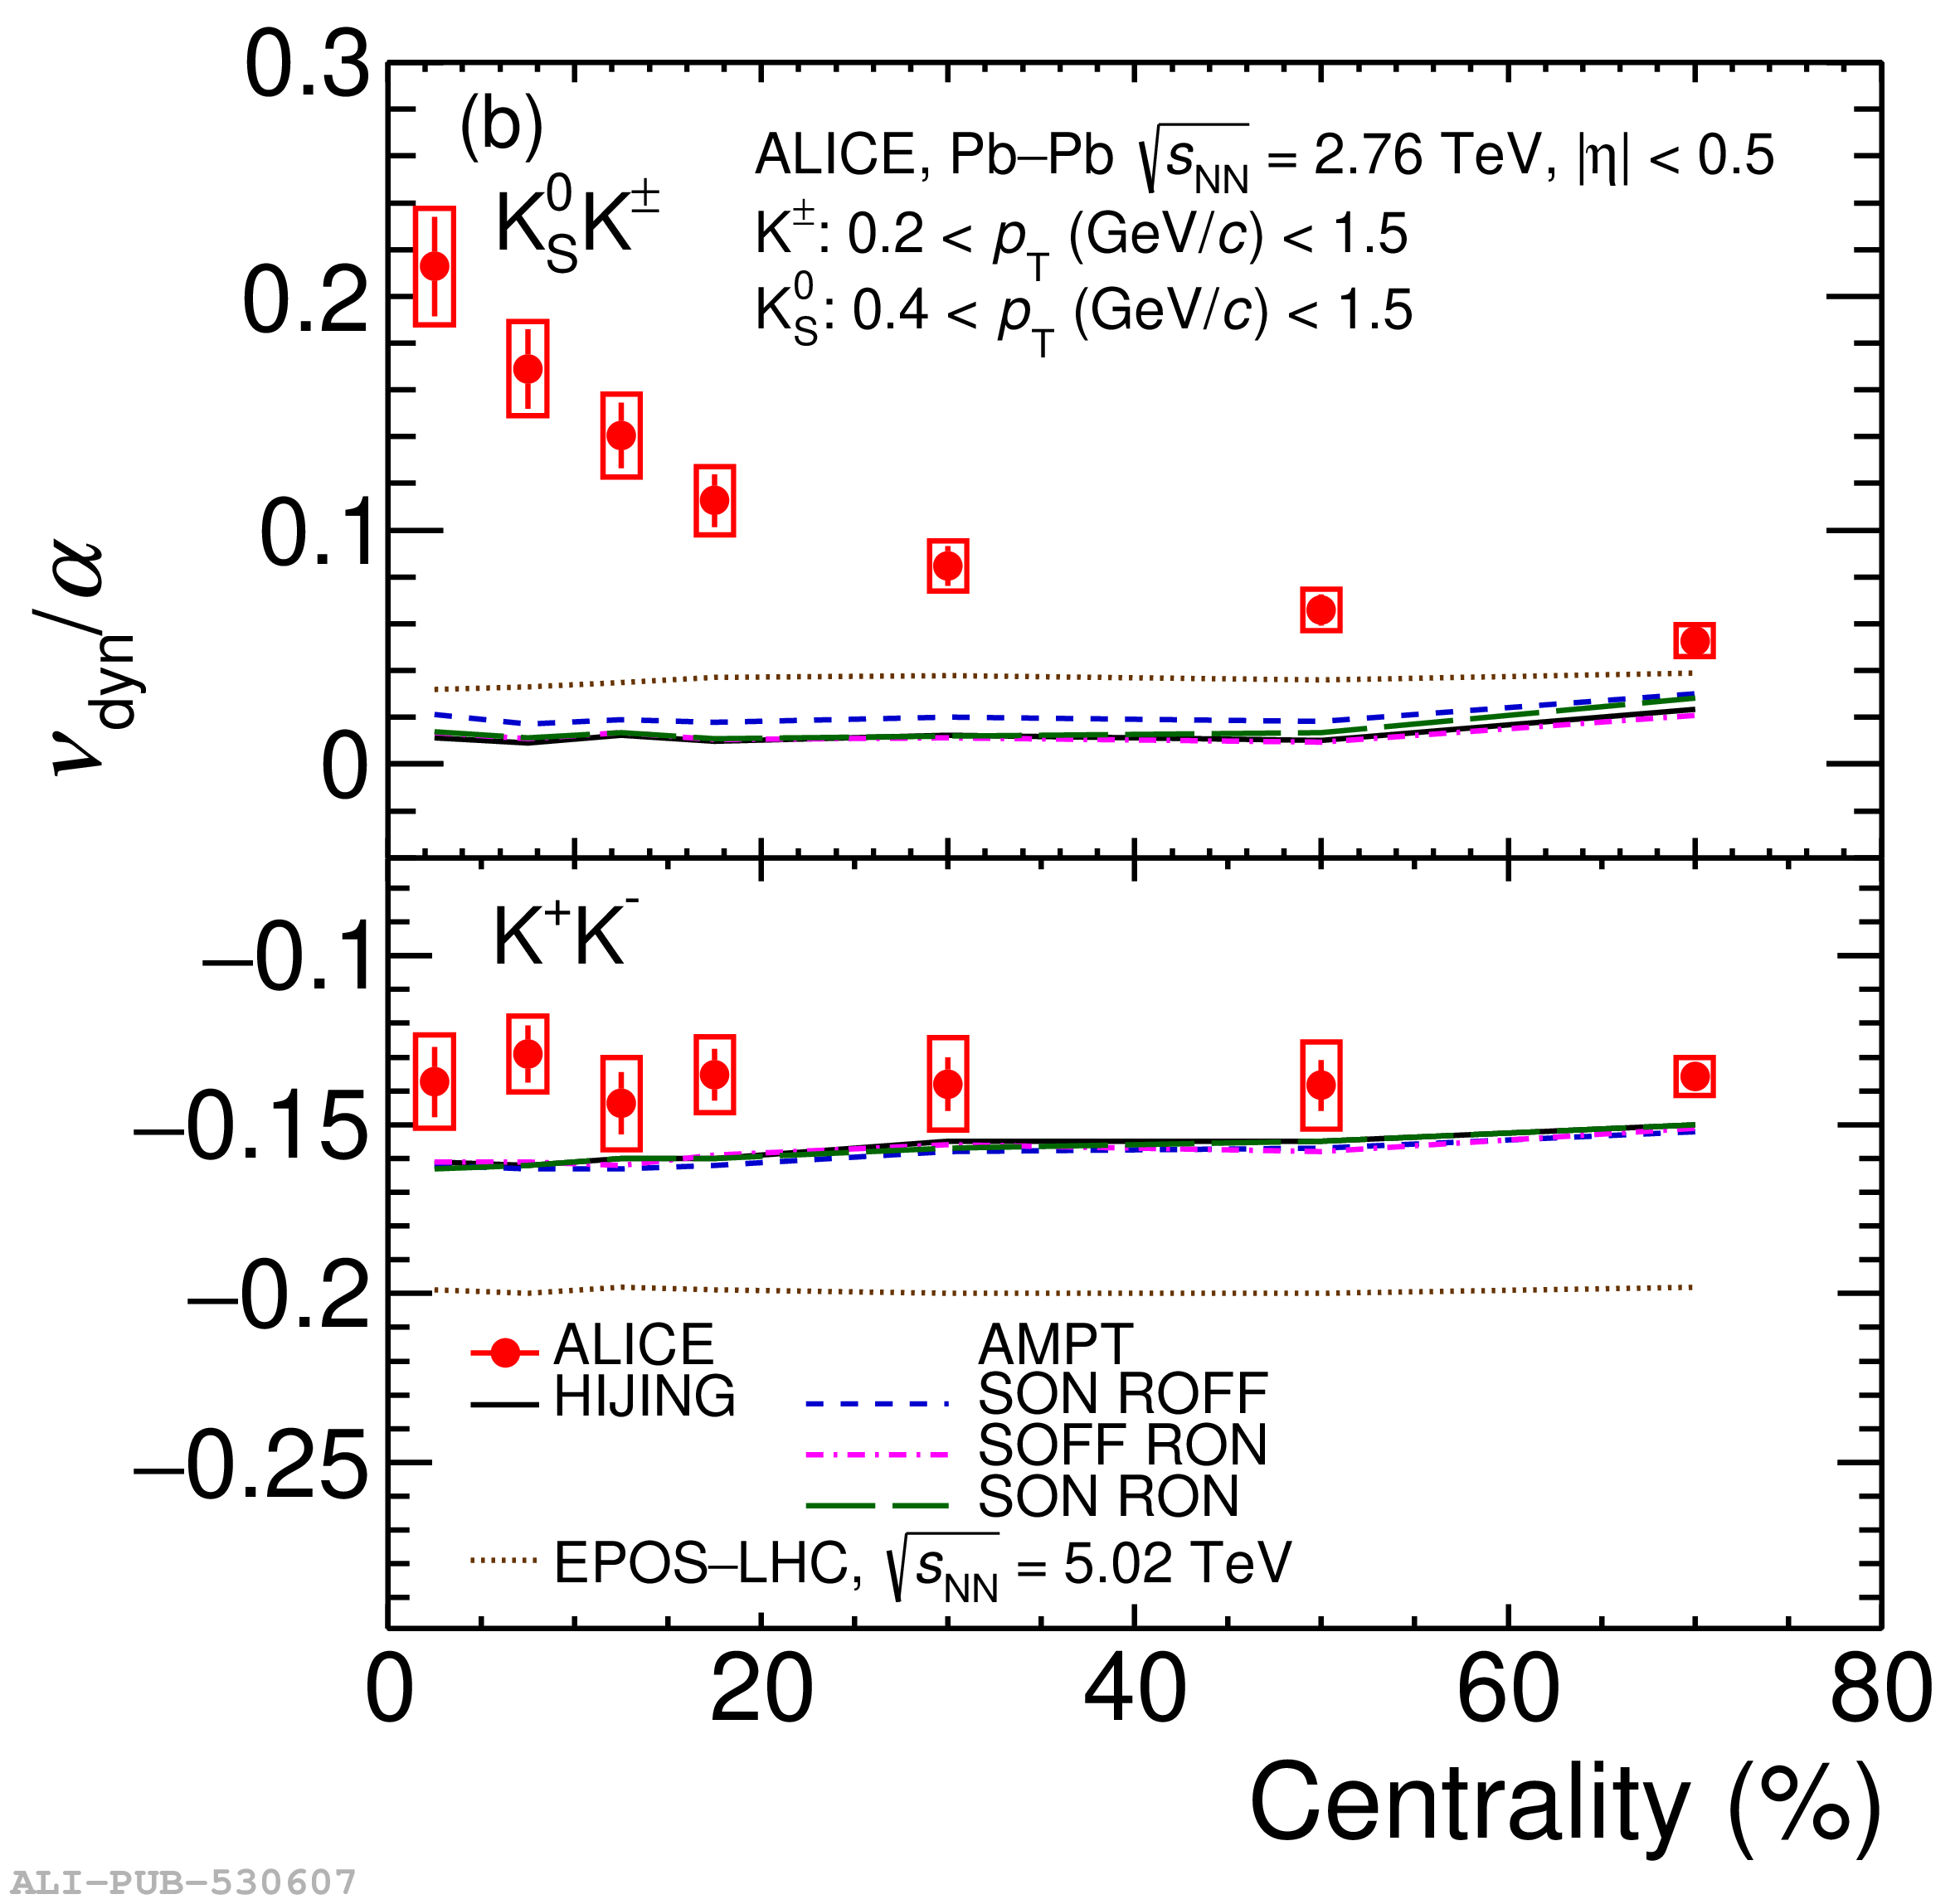 |
Figure 4
(a) top: measured and HIJING (generator level) predicted values of $\nu_{\rm dyn}[\rm K_{\rm S}^{0},\rm K^{\pm}]$ scaled by $\alpha$ as a function of collision centrality for various transverse momentum interval of charged kaons. HIJING predicted scaled values are multiplied by a factor of 5 to approximately match the measured values in most peripheral collisions; middle: ratio of data for various transverse momentum interval as a function of centrality; bottom: ratio of HIJING for various transverse momentum interval as a function of centrality. | 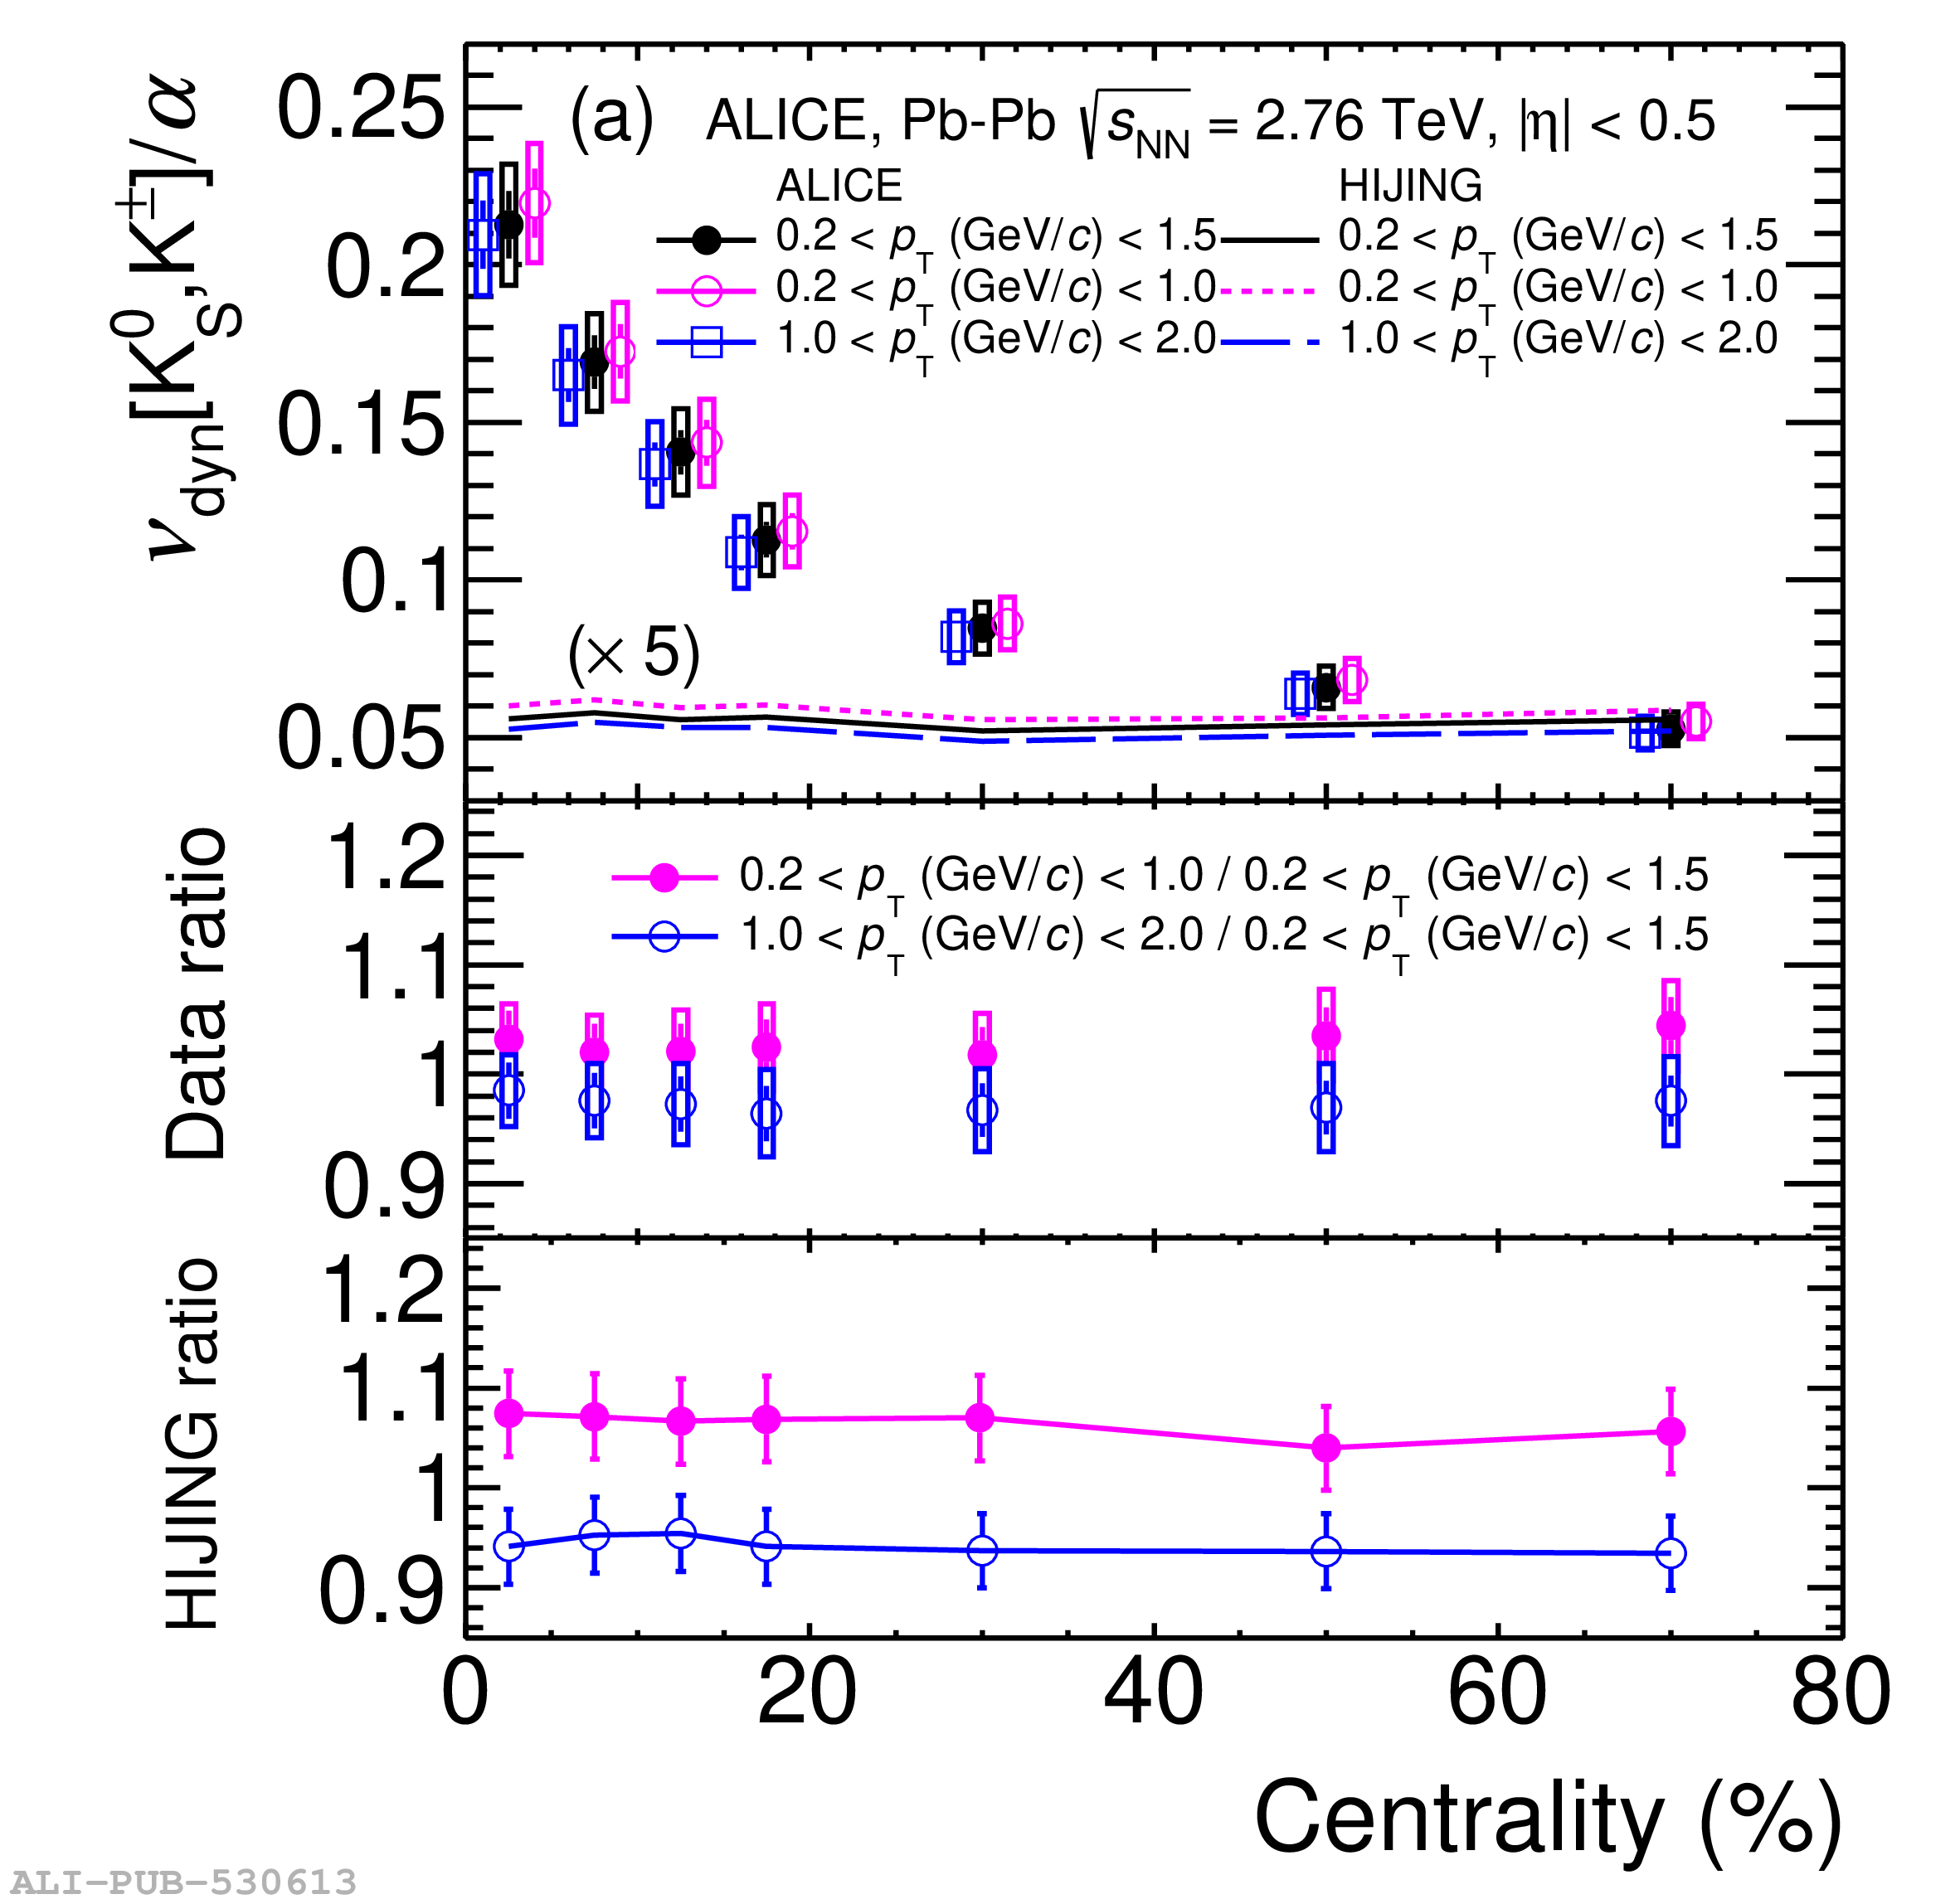 |
Figure 5
(a) Measured values of $\nu_{\rm dyn}[\rm K_{\rm S}^{0},\rm K^{\pm}]$ plotted as a function of the width of the acceptance $\Delta\eta$ in the 0--5\% and 5--10\% collision centrality ranges are compared HIJING (generator level) calculations scaled by a factor of 18. (b) Values of $\nu_{\rm dyn}[\rm K_{\rm S}^{0},\rm K^{\pm}]$ shown in panel (a) are scaled by $\alpha$ . HIJING values are scaled by a factor of 15 for easier comparison with the data. The statistical and systematic uncertainties are represented as bar and boxes, respectively. |  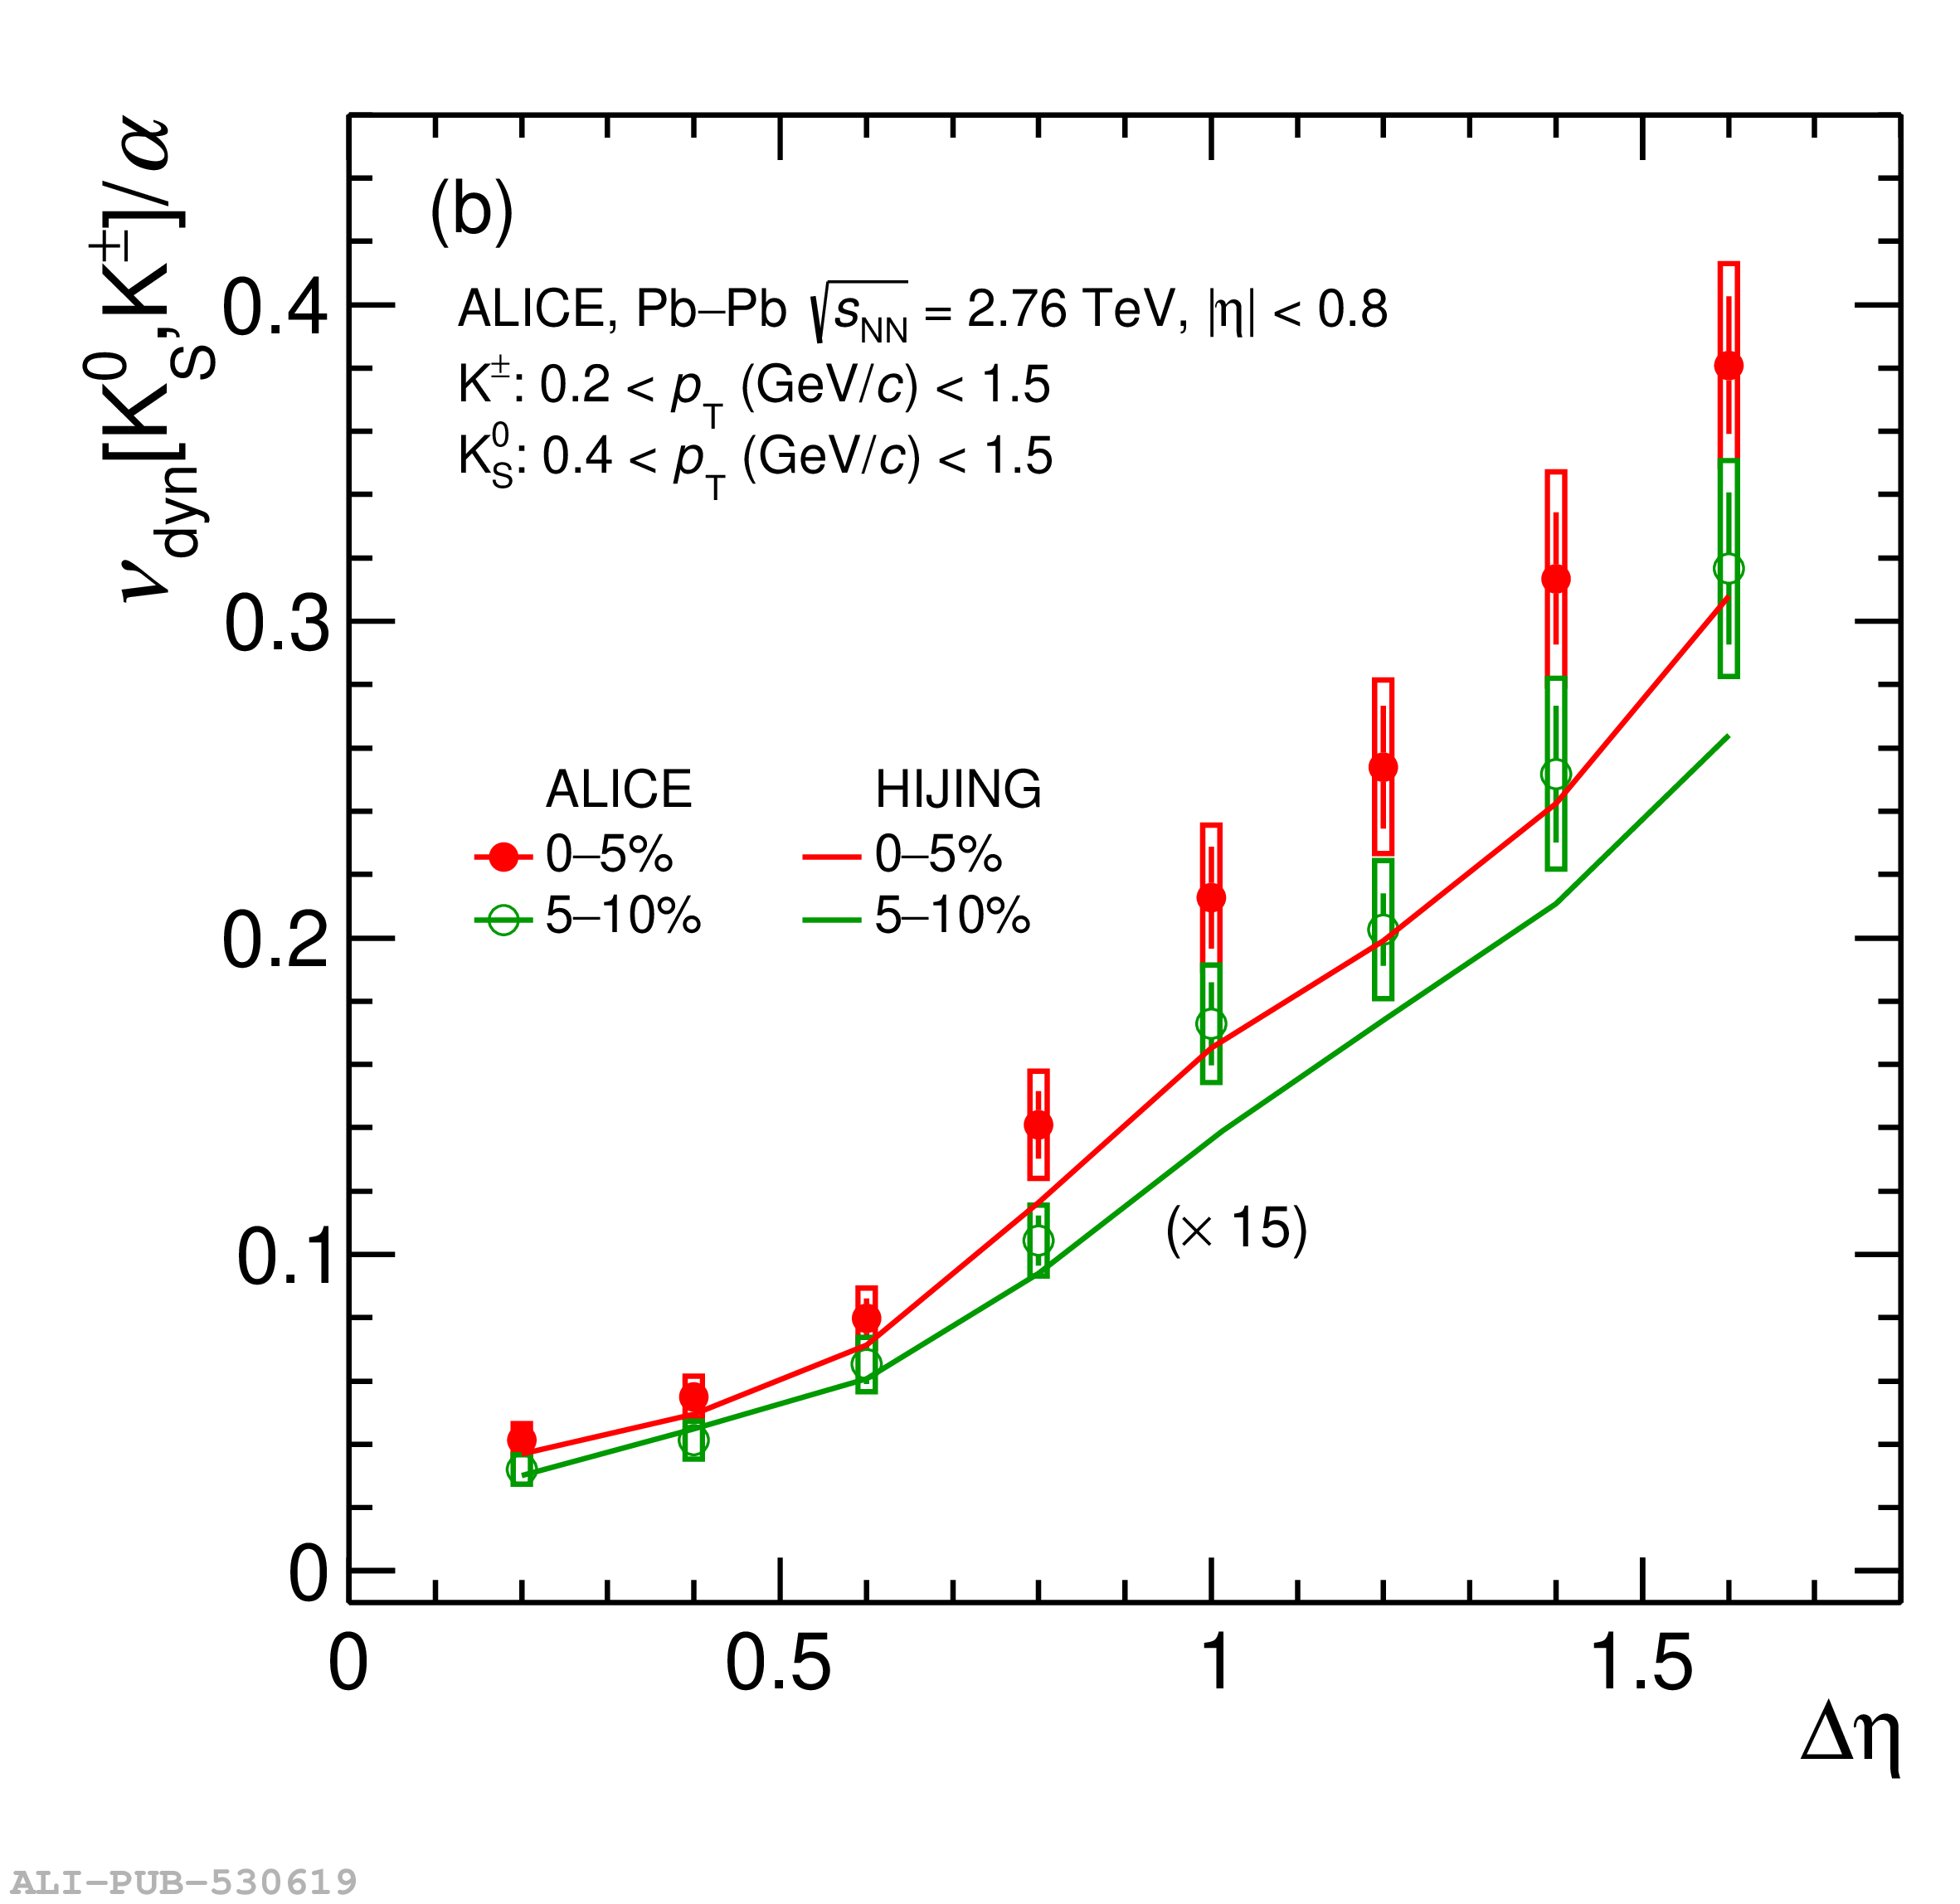 |