The cross section of jets reconstructed from charged particles is measured in the transverse momentum range of $5<~p_\mathrm{T}<~100\ \mathrm{GeV}/c$ in pp collisions at the center-of-mass energy of $\sqrt{s} = 5.02\ \mathrm{TeV}$ with the ALICE detector. The jets are reconstructed using the anti-$k_\mathrm{T}$ algorithm with resolution parameters $R=0.2$, $0.3$, $0.4$, and $0.6$ in the pseudorapidity range $|\eta|<~ 0.9-R$. The charged jet cross sections are compared with the leading order (LO) and to next-to-leading order (NLO) perturbative Quantum ChromoDynamics (pQCD) calculations. It was found that the NLO calculations agree better with the measurements. The cross section ratios for different resolution parameters were also measured. These ratios increase from low $p_\mathrm{T}$ to high $p_\mathrm{T}$ and saturate at high $p_\mathrm{T}$, indicating that jet collimation is larger at high $p_\mathrm{T}$ than at low $p_\mathrm{T}$. These results provide a precision test of pQCD predictions and serve as a baseline for the measurement in Pb$-$Pb collisions at the same energy to quantify the effects of the hot and dense medium created in heavy-ion collisions at the LHC.
Phys. Rev. D 100, 092004
HEP Data
e-Print: arXiv:1905.02536 | PDF | inSPIRE
CERN-EP-2019-070
Figure 2
Left: Detector response matrix for $R = 0.4$ charged jets. Right: Probability distribution of the relative momentum difference of simulated ALICE detector response to charged jets in pp collisions at $\sqrt{s} = $ 5.02 TeV for four different $p_\mathrm{T}$ intervals. Charged jets are simulated using PYTHIA8 Monash-2013 and reconstructed with the anti-$k_\mathrm{T}$ jet finding algorithm with $R = 0.4$. | 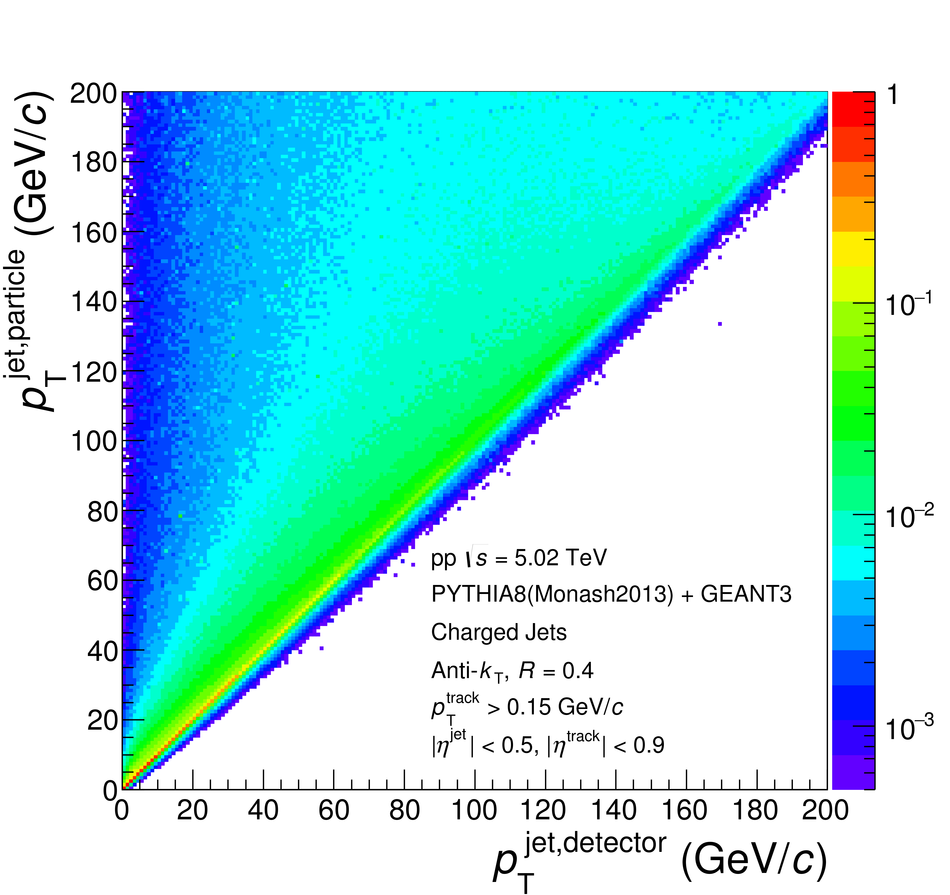 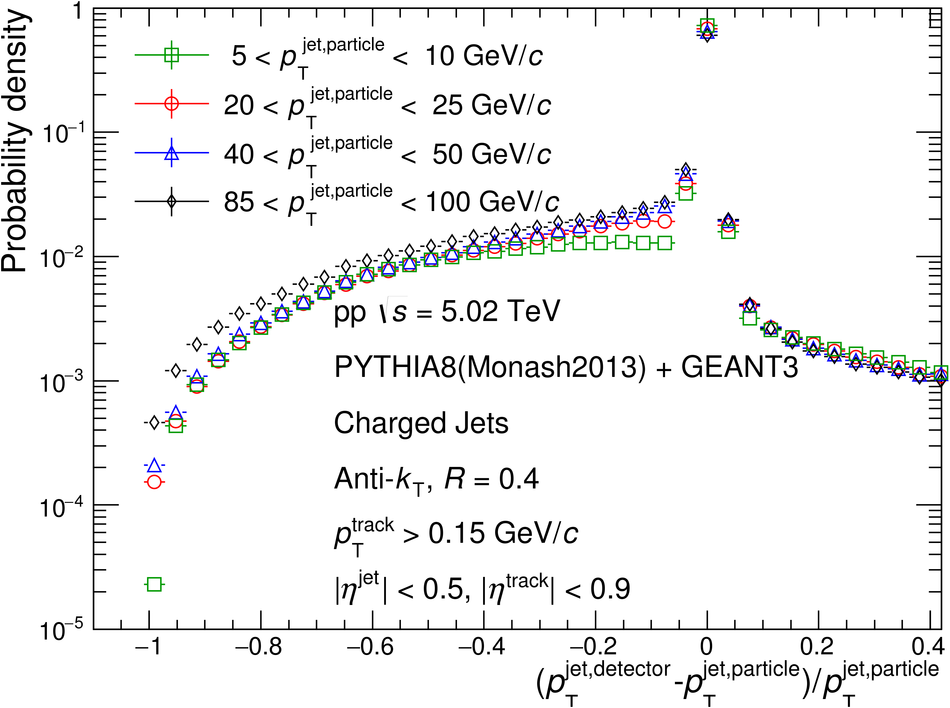 |
Figure 3
Charged jet differential cross sections in pp collisions at $\sqrt{s}$ = 5.02 TeV after detector effect corrections. Statistical uncertainties are displayed as vertical error bars. The total systematic uncertainties are shown as shaded bands around the data points. Data are scaled to enhance visibility. |  |
Figure 4
Comparison of the charged jet cross section to LO MC predictions with different jet resolution parameter $R=0.2$ (a), $0.3$ (b), $0.4$ (c), and $0.6$ (d). Statistical uncertainties are displayed as vertical error bars. The systematic uncertainty on the data is indicated by a shaded band drawn around unity. The red lines in the ratio correspond to unity. | 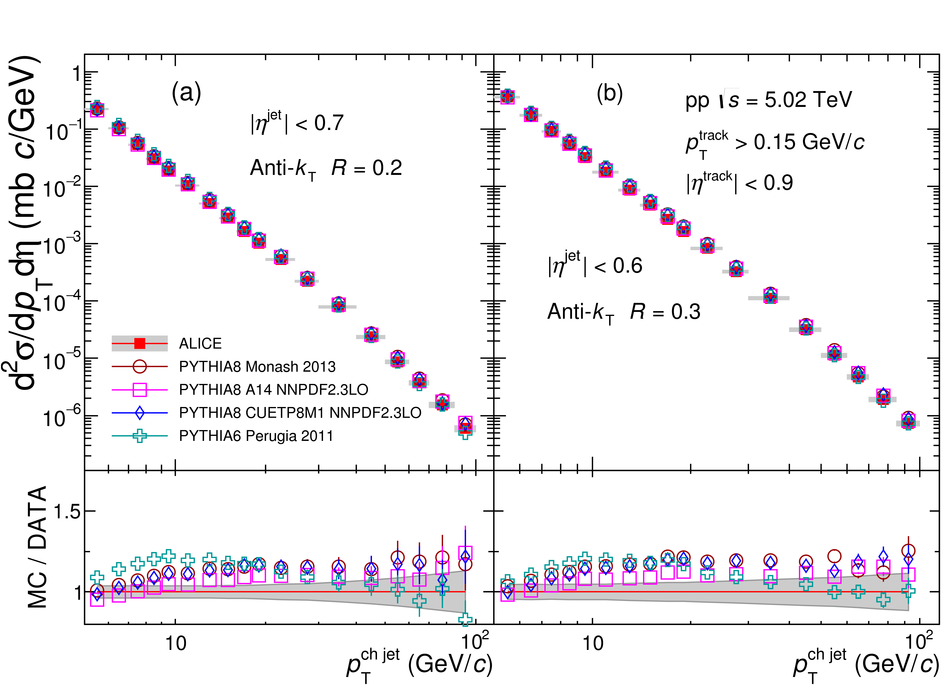 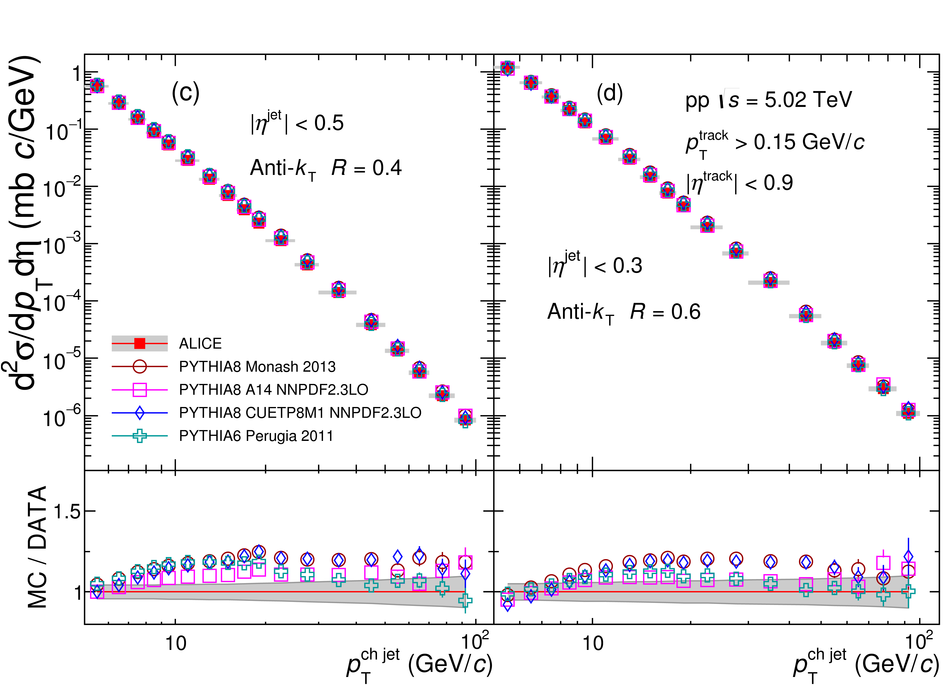 |
Figure 5
Comparison of the charged jet cross section to NLO MC predictions (POWHEG+PYTHIA8) with different jet resolution parameter $R=0.2$ (a), $0.3$ (b), $0.4$ (c), and $0.6$ (d). Statistical uncertainties are displayed as vertical error bars. The systematic uncertainty on the data is indicated by a shaded band drawn around unity. The red lines in the ratio correspond to unity. | 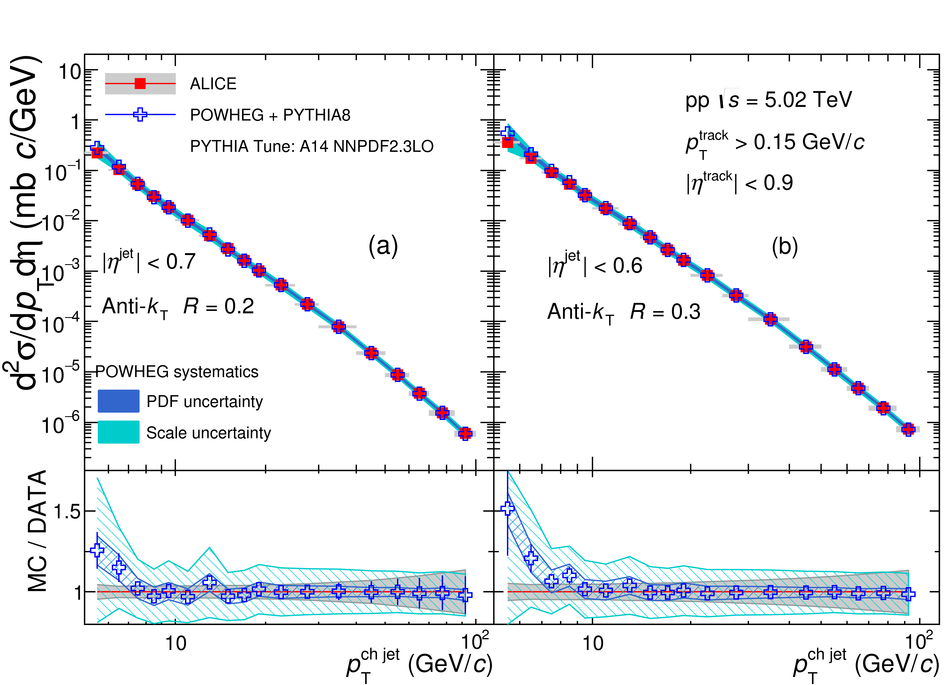 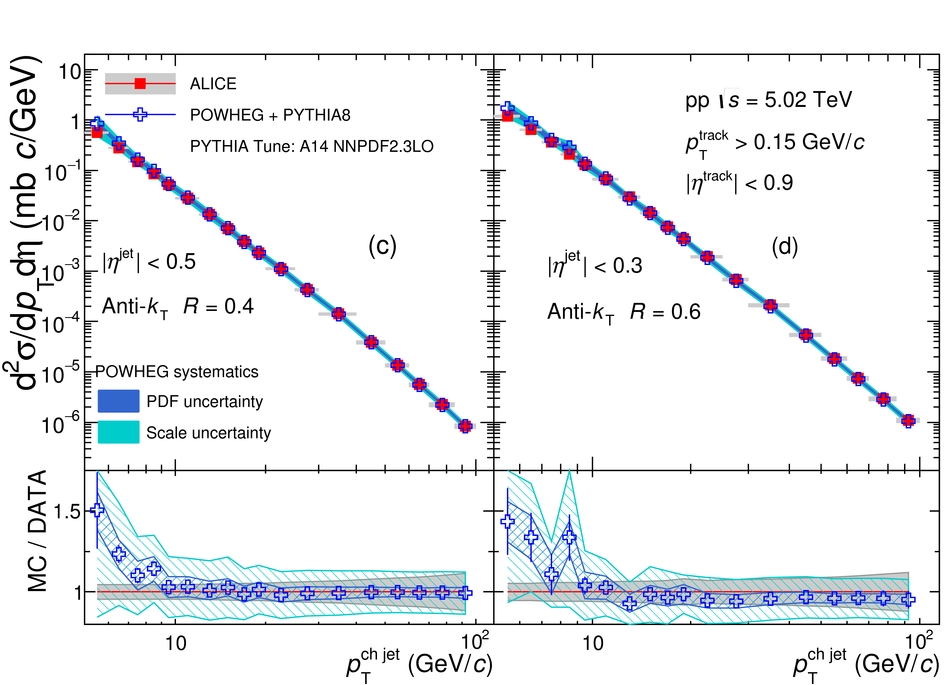 |
Figure 6
Charged jet cross section ratios for $\sigma(R=0.2)/\sigma(R=0.4)$ (Red) and $\sigma(R=0.2)/\sigma(R=0.6)$(Blue) in comparison with LO (PYTHIA) and NLO event generators with matched parton showers and modelling of hadronization and the UE (POWHEG+PYTHIA8). The systematic uncertainty of the cross section ratio is indicated by a shaded band drawn around data points. No uncertainties are drawn for theoretical predictions for better visibility. | 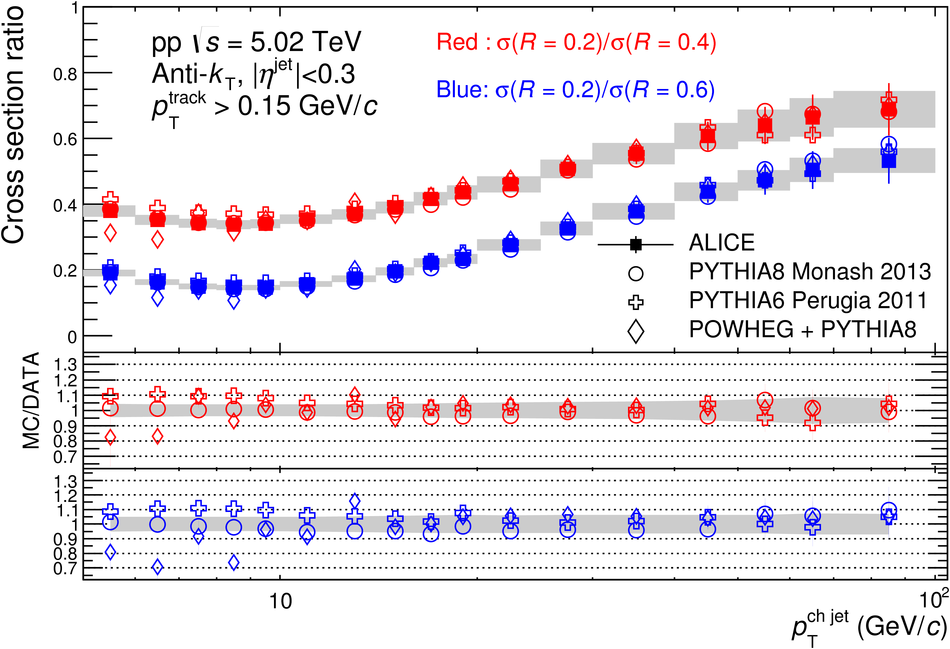 |
Figure 7
Charged jet cross section ratio in pp collisions at $\sqrt{s} = 5.02\ \mathrm{TeV}$ is compared to p-Pb collisions at $\sqrt{s_\mathrm{NN}} = 5.02 \ \mathrm{TeV}$ and pp collisions at $\sqrt{s} = 7\ \mathrm{TeV}$ . Left: $\sigma(R=0.2)/\sigma(R=0.4)$; Right: $\sigma(R=0.2)/\sigma(R=0.6)$ | 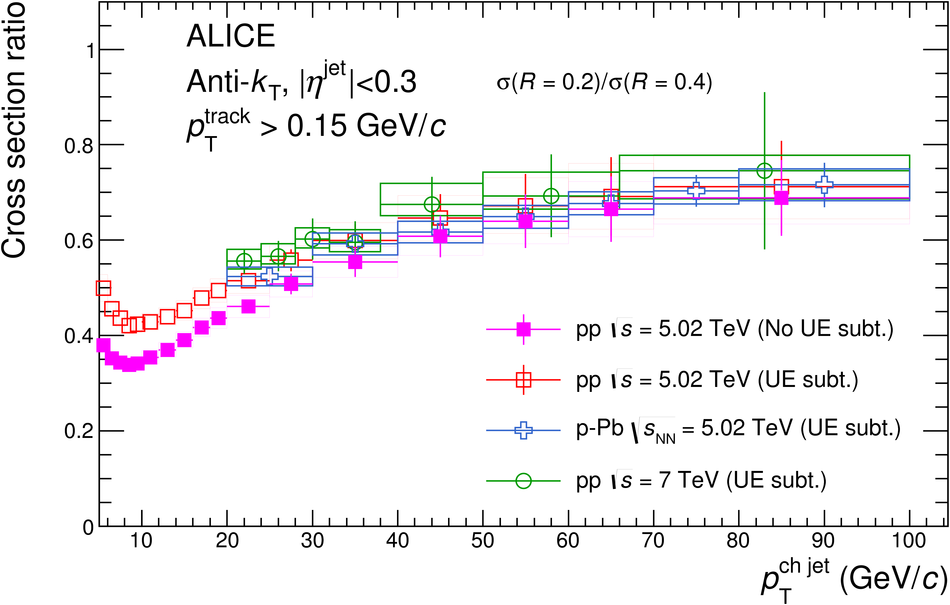 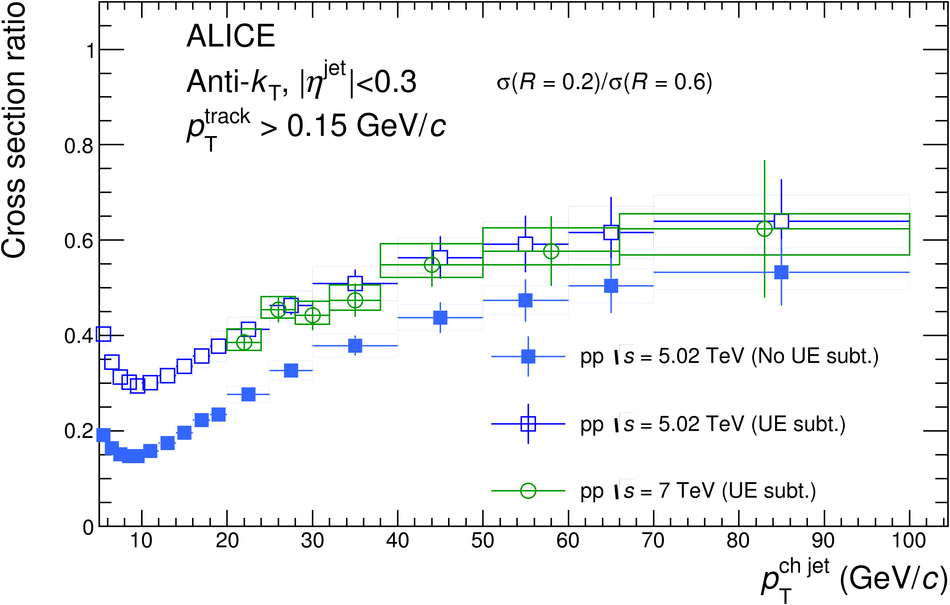 |