The expected dependence of the CME signal on $v_2$ for various centrality classes from a MC-Glauber simulation (see text for details). No event shape selection is performed in the model, and therefore a large range in $v_2$ is covered. The solid lines depict linear fits based on the $v_2$ variation observed within each centrality interval. | 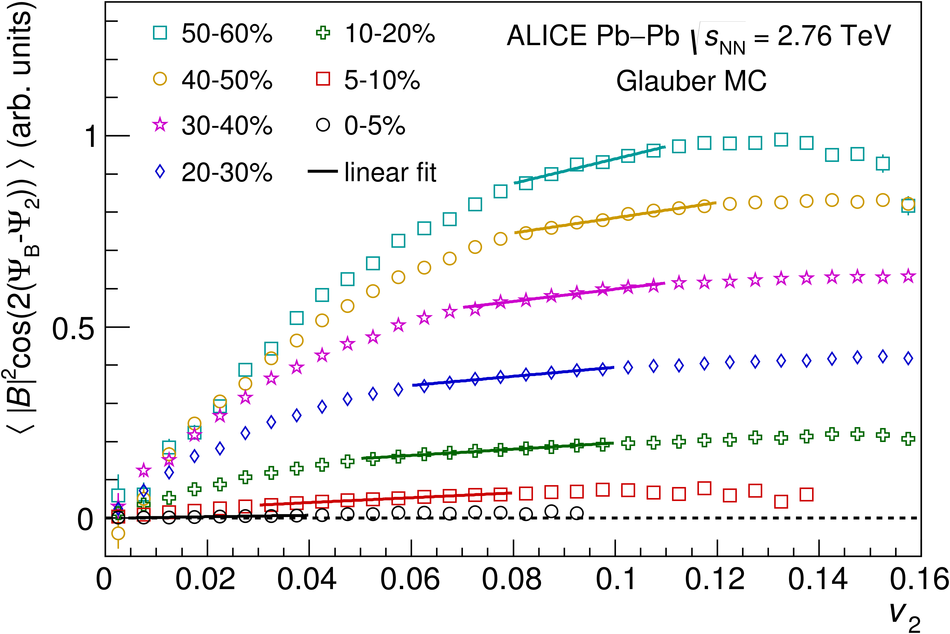 |