The measurement of the azimuthal-correlation function of prompt D mesons with charged particles in pp collisions at $\sqrt{s}$ = 5.02 TeV and p-Pb collisions at $\sqrt{s_{\rm NN}}$ = 5.02 TeV with the ALICE detector at the LHC is reported. The D$^{\rm 0}$, D$^{\rm +}$, and D$^{\rm *+}$ mesons, together with their charge conjugates, were reconstructed at midrapidity in the transverse momentum interval 3 <~ $p_{\rm T}$ <~ 24 GeV/c and correlated with charged particles having $p_{\rm T}$ > 0.3 GeV/c and pseudorapidity $|\eta| <~$ 0.8. The properties of the correlation peaks appearing in the near- and away-side regions (for $\Delta \varphi \approx$ 0 and $\Delta \varphi \approx \pi$, respectively) were extracted via a fit to the azimuthal correlation functions. The shape of the correlation functions and the near- and away-side peak features are found to be consistent in pp and p-Pb collisions, showing no modifications due to nuclear effects within uncertainties. The results are compared with predictions from Monte Carlo simulations performed with the PYTHIA, POWHEG+PYTHIA, HERWIG, and EPOS 3 event generators.
EPJC 80 (2020) 979
HEP Data
e-Print: arXiv:1910.14403 | PDF | inSPIRE
CERN-EP-2019-239
Figure group
Figure 1
Invariant mass (mass-difference) distributions of $\Dzero$, $\Dplus$ ($\Dstar$), and charge conjugates, candidates in three $\ptD$ intervals for pp collisions at $\s$ = 5.02 TeV (top row) and \pPb collisions at $\snn$ = 5.02 TeV (bottom row). The curves show the fit functions applied to the distributions. For the $\Dzero$, the dashed line represents the combinatorial background including the contribution of reflection candidates (see ). | 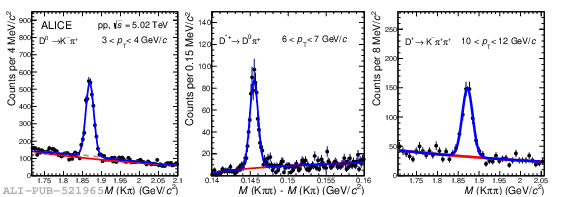  |
Figure 2
Examples of the fit to the D-meson average azimuthal-correlation function, for 5 < pDT < 8 GeV/c, passocT > 0.3 GeV/c in pp collisions (left), and for 8 < pDT < 16 GeV/c, 1 < passocT < 2 GeV/c in p–Pb collisions
(right). The statistical uncertainties are shown as vertical error bars. The fit function described in Eq. 3 is shown as a red solid curve. Its different terms are shown separately: near-side generalised Gaussian function, away-side Gaussian function, and baseline constant term. The scale uncertainty (see Sec. 4) is also reported for completeness. | 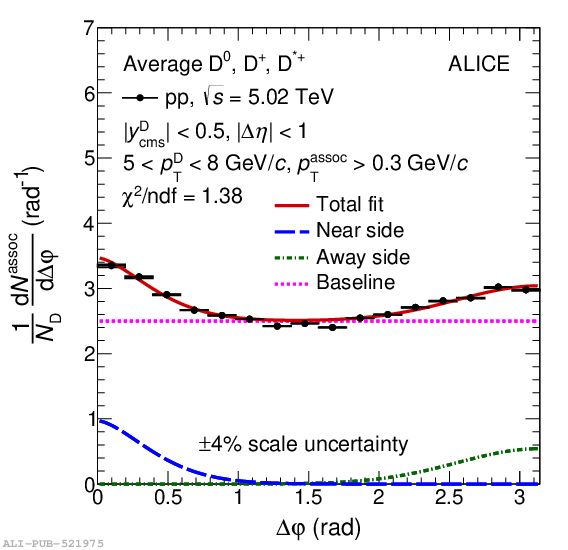  |
Figure 3
Average of the azimuthal-correlation functions of D0, D+, and D∗+ mesons with associated particles, after the subtraction of the baseline, in pp collisions at √s = 5.02 TeV and p–Pb collisions at √sNN = 5.02 TeV, for 3 < pDT < 5 GeV/c, 5 < pDT < 8 GeV/c, 8 < pDT < 16 GeV/c, and 16 < pDT < 24 GeV/c (from left to right) and passocT > 0.3 GeV/c, 0.3 < passocT < 1 GeV/c, 1 < passocT < 2 GeV/c, and 2 < passocT < 3 GeV/c (from top to bottom). Statistical and ∆φ-dependent systematic uncertainties are shown as vertical error bars and boxes, respectively, ∆φ-independent uncertainties are written as text. The uncertainties from the subtraction of the baseline are displayed as boxes at ∆φ > π.
| 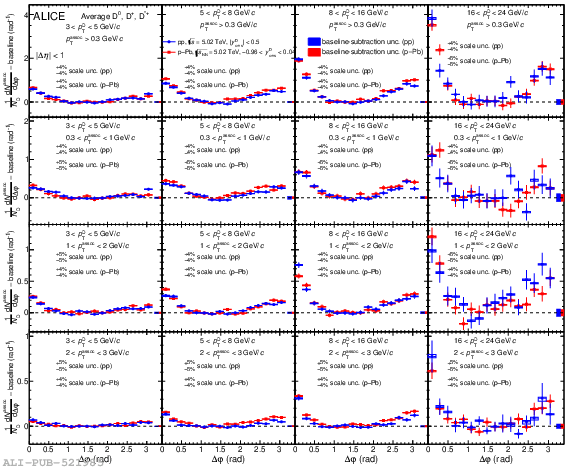 |
Figure 4
Near-side peak associated yields (top row) and widths (bottom row) in pp collisions at √s = 5.02 TeV and p–Pb collisions at √sNN = 5.02 TeV, as a function of the D-meson pT, for passocT > 0.3 GeV/c, 0.3 < passocT < 1 GeV/c, 1 < passocT < 2 GeV/c, and 2 < passocT < 3 GeV/c (from left to right). Statistical and systematic uncertainties are shown as vertical error bars and boxes, respectively. The points and error boxes for pp collisions are shifted by ∆pT = −0.2 GeV/c. | 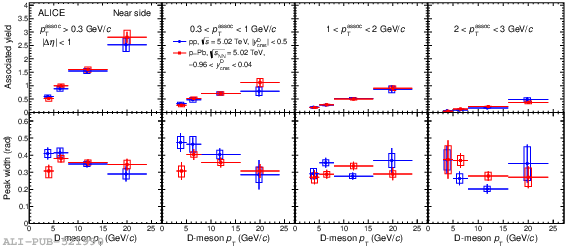 |
Figure 5
Away-side peak associated yields (top row) and widths (bottom row) in pp collisions at √s = 5.02 TeV and p–Pb collisions at √sNN = 5.02 TeV, as a function of the D-meson pT, for passoc T > 0.3 GeV/c,
0.3 < passoc T < 1 GeV/c, 1 < passoc T < 2 GeV/c, and 2 < passoc T < 3 GeV/c (from left to right). Statistical and systematic uncertainties are shown as vertical error bars and boxes, respectively. The points and error boxes for pp collisions are shifted by ∆pT = −0.2 GeV/c. | 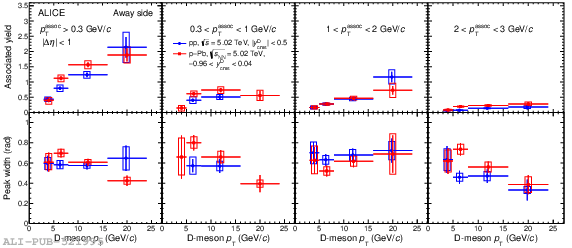 |
Figure 6
Average of the azimuthal-correlation functions of $\Dzero$, $\Dplus$, and $\Dstar$ mesons with associated particles, after the subtraction of the baseline, for \pPb collisions in three different centrality classes, 0--20\% (blue circles), 20--60\% (red squares), and 60--100\% (green diamonds). The functions are shown for $3 0.3$ \GeVc, $0.3 1$ \GeVc (from top to bottom). Statistical and $\Dphi$-dependent systematic uncertainties are shown as vertical error bars and boxes, respectively, while $\Dphi$-independent uncertainties are written as text. The uncertainties from the subtraction of the baseline are displayed as boxes at $\Dphi > \pi$. | 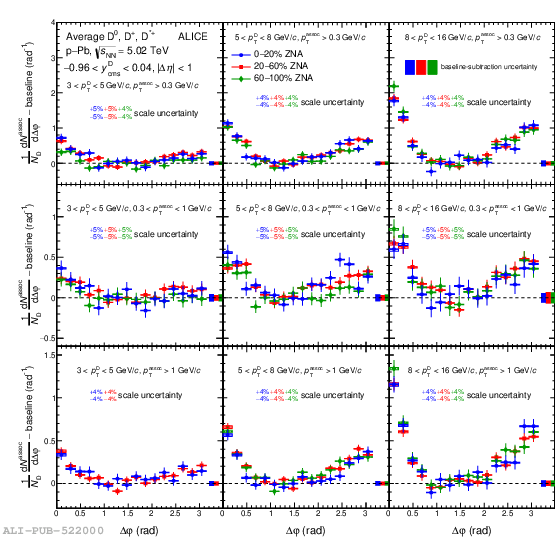 |
Figure 7
Comparison of near-side associated peak yields (top row) and widths (bottom row) as a function of the D-meson $\pt$, for \pPb collisions in three different centrality classes, 0--20\% (blue circles), 20--60\% (red squares), and 60--100\% (green diamonds). The results are presented as a function of the D-meson $\pt$, for $\ptass > 0.3$ \GeVc, $0.3 1$ \GeVc (from left to right). Statistical and systematic uncertainties are shown as vertical error bars and boxes, respectively. The points and error boxes for 0--20\% (60--100\%) collisions are shifted by $\Delta\pt = -0.2$ ($+0.2$) \GeVc | 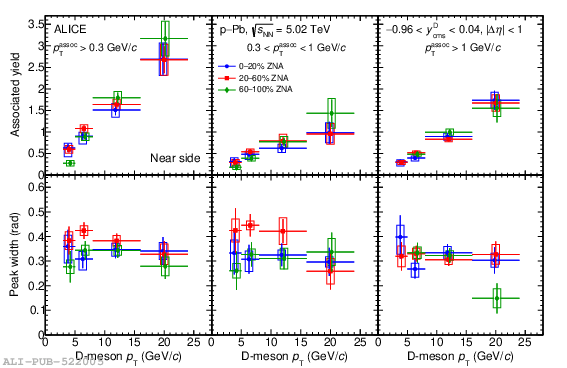 |
Figure 8
The average of the azimuthal-correlation functions of D0, D+, and D∗+ mesons with associated particles, after the subtraction of the baseline, in pp collisions at √s = 5.02 TeV, compared to predictions from the
PYTHIA, POWHEG+PYTHIA6, POWHEG LO+PYTHIA6, HERWIG, and EPOS 3 event generators with various configurations (see text for details). The functions are shown for 3 < pDT < 5 GeV/c, 5 < pDT < 8 GeV/c,8 < pDT < 16 GeV/c, and 16 < pDT < 24 GeV/c (from left to right) and passocT > 0.3 GeV/c, 0.3 < passocT < 1 GeV/c, 1 < passocT < 2 GeV/c, and 2 < passocT < 3 GeV/c (from top to bottom). Statistical and ∆φ-dependent systematic uncertainties are shown as vertical error bars and boxes, respectively, while the ∆φ-independent uncertainties are written as text. The uncertainties from the subtraction of the baseline are displayed as boxes at ∆φ > π | 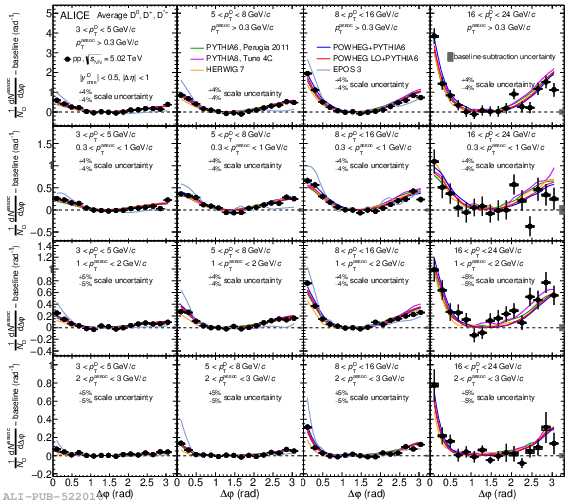 |
Figure 9
Measurements of near-side associated peak yields (top row) and widths (third row down) in pp collisions at √s = 5.02 TeV, compared to predictions by the PYTHIA, POWHEG+PYTHIA6, POWHEG LO+PYTHIA6,
HERWIG, and EPOS 3 event generators with various configurations (see text for details). The ratios of yield (width) values with respect to the predictions by POWHEG+PYTHIA6 are shown in the second (fourth) row down. Results are presented as a function of the D-meson pT, for passoc T > 0.3 GeV/c, 0.3 < passoc T < 1 GeV/c, 1 < passoc T < 2 GeV/c, and 2 < passoc T < 3 GeV/c (from left to right). Statistical and systematic uncertainties are shown as vertical error bars and boxes, respectively. | 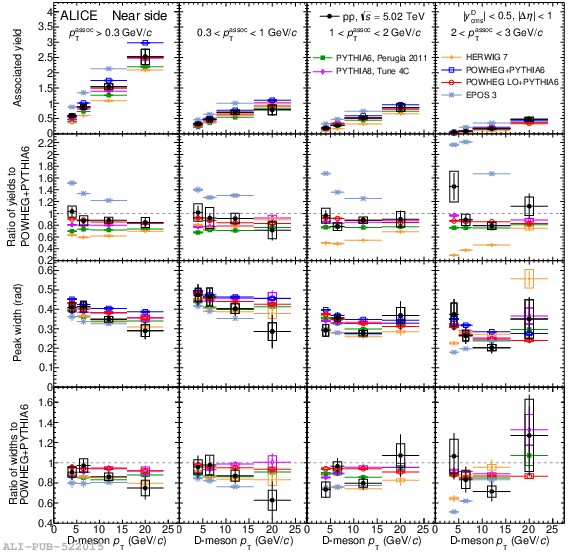 |
Figure 10
Measurements of away-side associated peak yields (top row) and widths (third row down) in pp collisions at √s = 5.02 TeV, compared to predictions by the PYTHIA, POWHEG+PYTHIA6, POWHEG
LO+PYTHIA6, and HERWIG event generators with various configurations (see text for details). The ratios of yield (width) values with respect to the predictions by POWHEG+PYTHIA6 are shown in the second (fourth) row down. Results are presented as a function of the D-meson pT, for passoc T > 0.3 GeV/c, 0.3 < passoc T < 1 GeV/c, 1 < passoc T < 2 GeV/c, and 2 < passoc T < 3 GeV/c (from left to right). Statistical and systematic uncertainties are shown as vertical error bars and boxes, respectively. |  |
Figure 11
Measurements of azimuthal-correlation function baseline height in pp collisions at √s = 5.02 TeV, compared to predictions by the PYTHIA, POWHEG+PYTHIA6, POWHEG LO+PYTHIA6, HERWIG, and EPOS
3 event generators with various configurations in the top row (see text for details). The ratios of baselines with respect to predictions by POWHEG+PYTHIA6 are shown in the bottom row. Results are presented as a function of the D-meson pT, for passoc T > 0.3 GeV/c, 0.3 < passoc T < 1 GeV/c, 1 < passoc T < 2 GeV/c, and 2 < passoc T < 3 GeV/c (from left to right). Statistical and systematic uncertainties are shown as vertical error bars and boxes, respectively. | 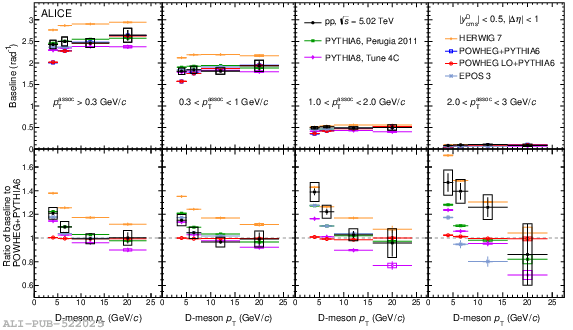 |