Inclusive \ee cross section in \pp collisions at \roots = 7\,TeV in the ALICE acceptance as a function of mass. The data are compared with a cocktail of expected sources. In the lower panel, the ratio of data to cocktail is shown. Statistical and systematic uncertainties of the data are plotted as vertical bars and boxes, respectively. The total uncertainty of the cocktail is represented as a grey band. | 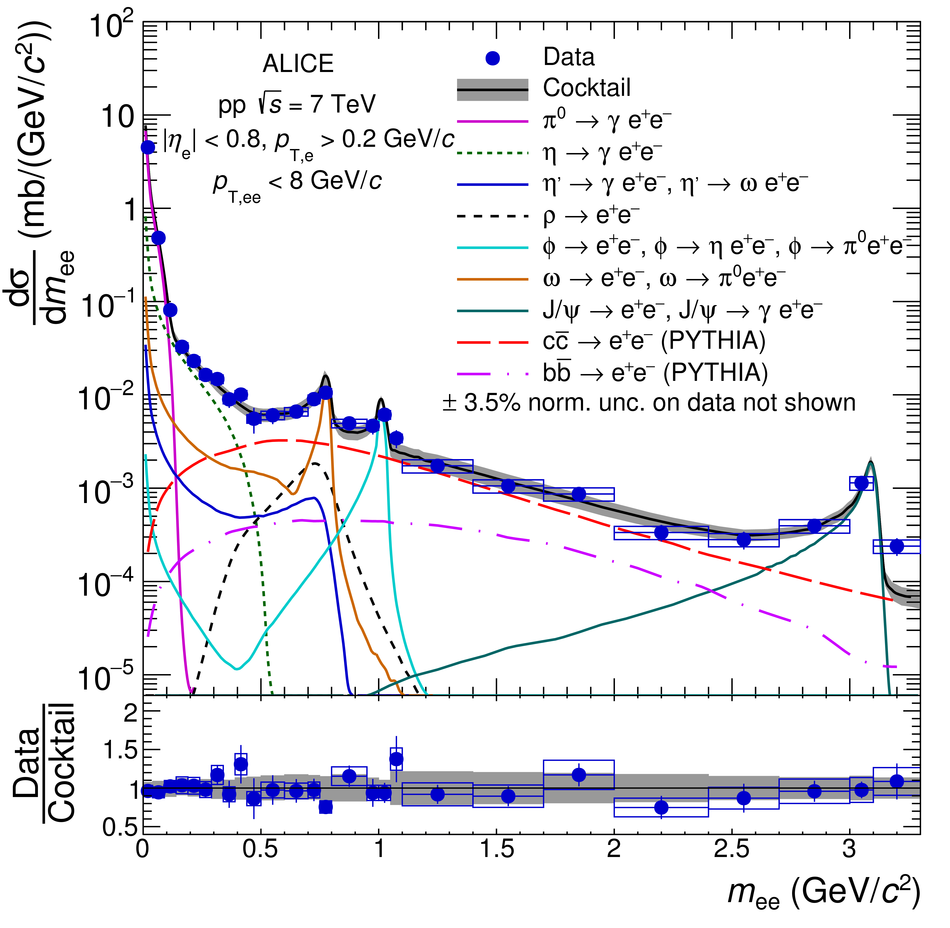 |