Average $\RAA$ of $\Dzero$, $\Dplus$ and $\Dstar$ mesons compared with model calculations. The three rows refer to the 0--10\%, 30--50\% and 60--80\% centrality classes. The left panels show models based on heavy-quark transport, while the right panels show models based on pQCD energy loss. Model nomenclature and references:BAMPS , CUJET3.0 ,Djordjevic ,LBT ,MC@sHQ+EPOS2 ,PHSD POWLANG , SCET ,TAMU Some of the models are presented with two lines with the same style and colour, which encompass the model uncertainty band. | 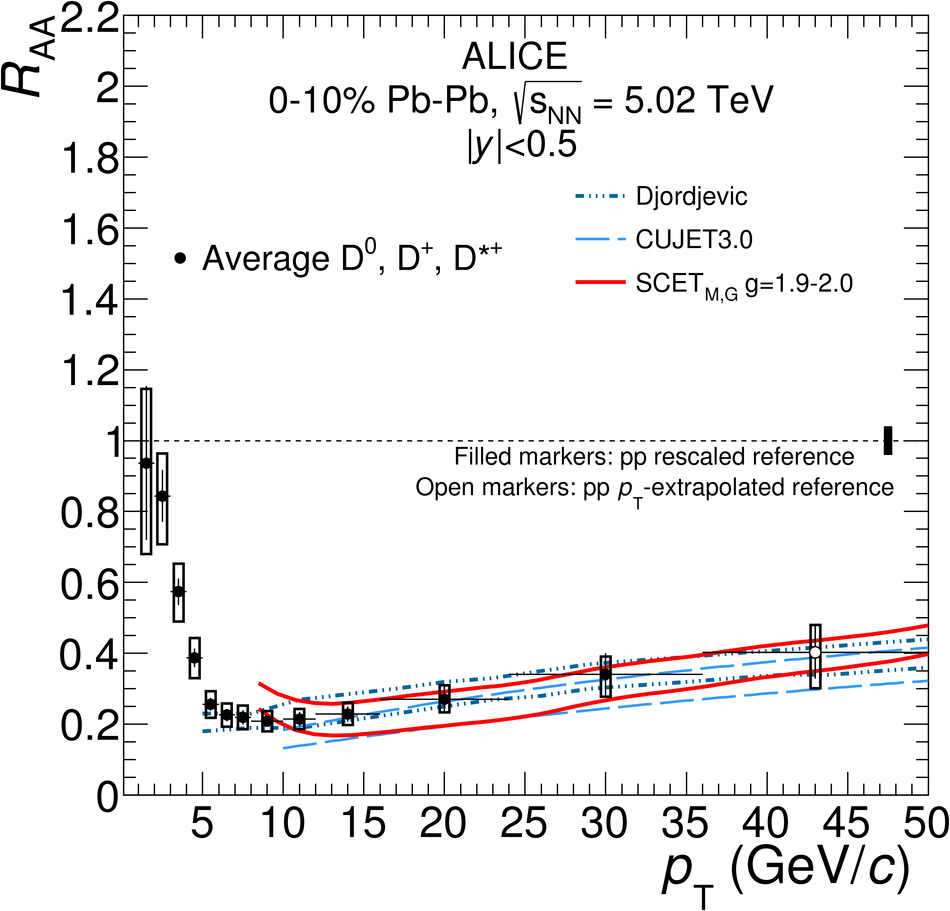 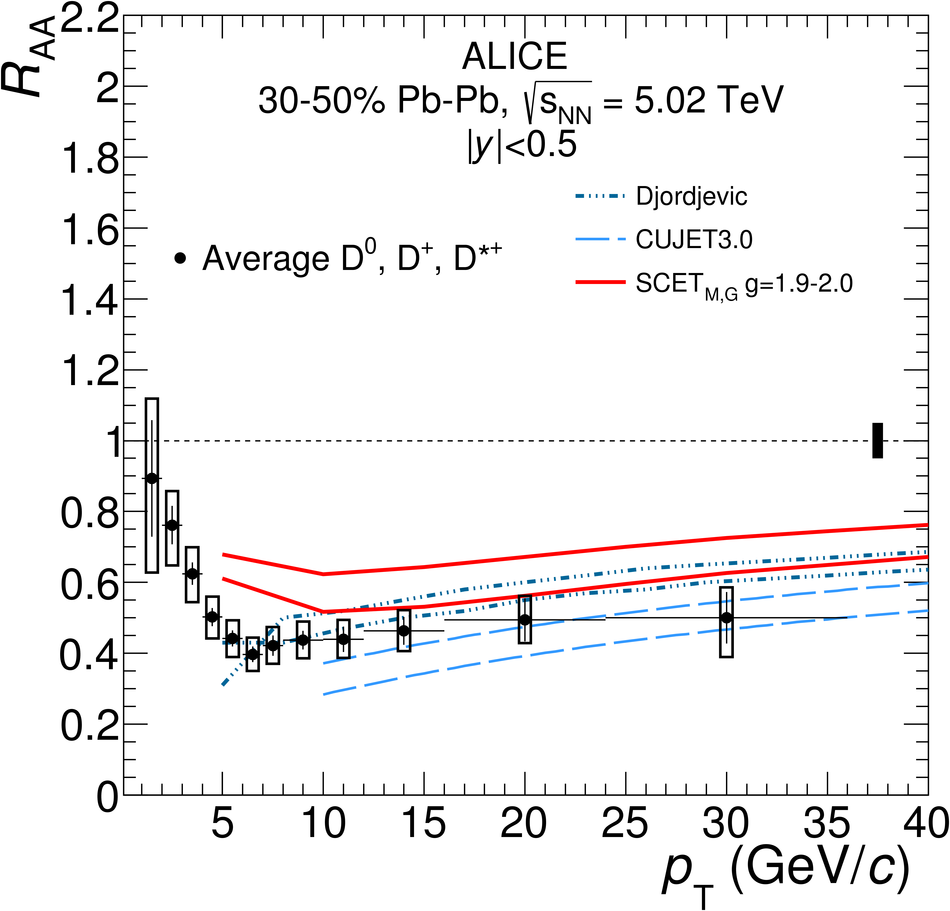 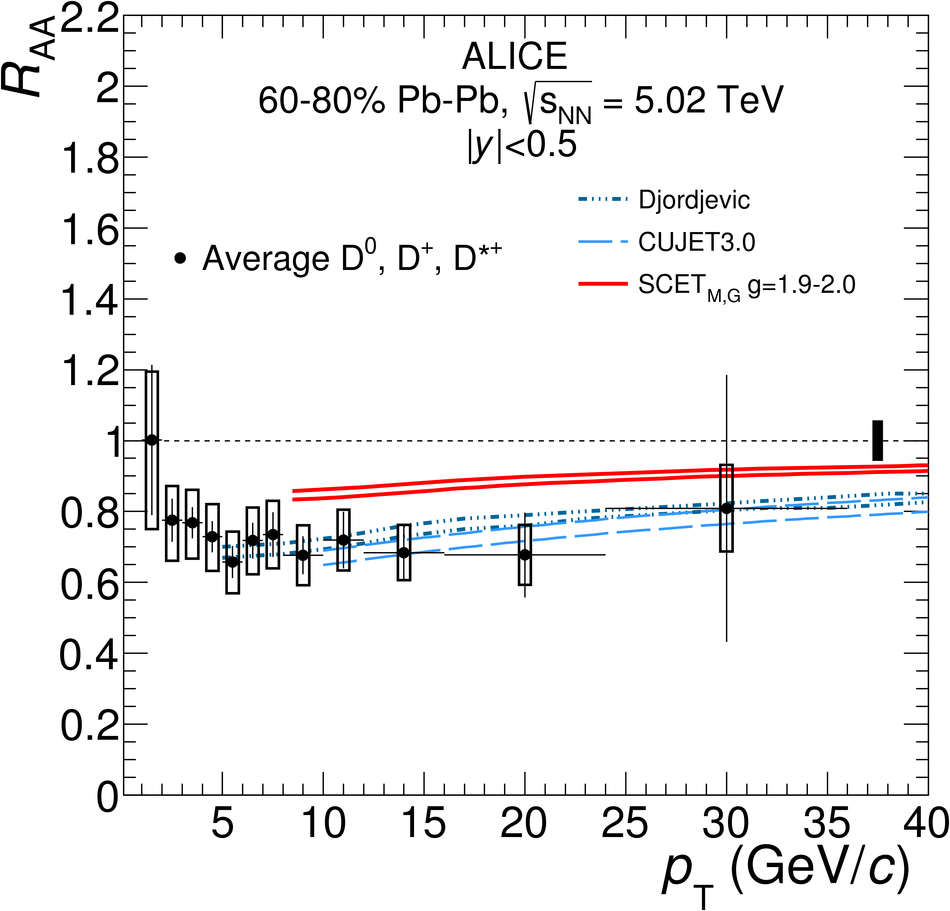 |
![[png]](https://alice-publications.web.cern.ch/sites/default/files/papers/4251/DmesonAverage_010_transport_Models_-90611.png)
![[png]](https://alice-publications.web.cern.ch/sites/default/files/papers/4251/DmesonAverage_3050_transport_Models_-90615.png)
![[png]](https://alice-publications.web.cern.ch/sites/default/files/papers/4251/DmesonAverage_6080_transport_Models_-90619.png)