Average pulse height vs.\ drift time plot (derived from Fig. \ref{fig:ph}) illustrating the main calibration parameters. For better understanding, a sketch of the chamber cross-section with field lines from Fig. \ref{fig:roccross} is shown at the top. The peak at the left and the edge on the right of the drift time spectrum correspond to the anode wires and the chamber entrance window. The temporal difference between them depends on the drift velocity. The anode-peak position defines the time offset. The mean pulse height and the pedestal width are related to the gain and the pad noise, respectively. | 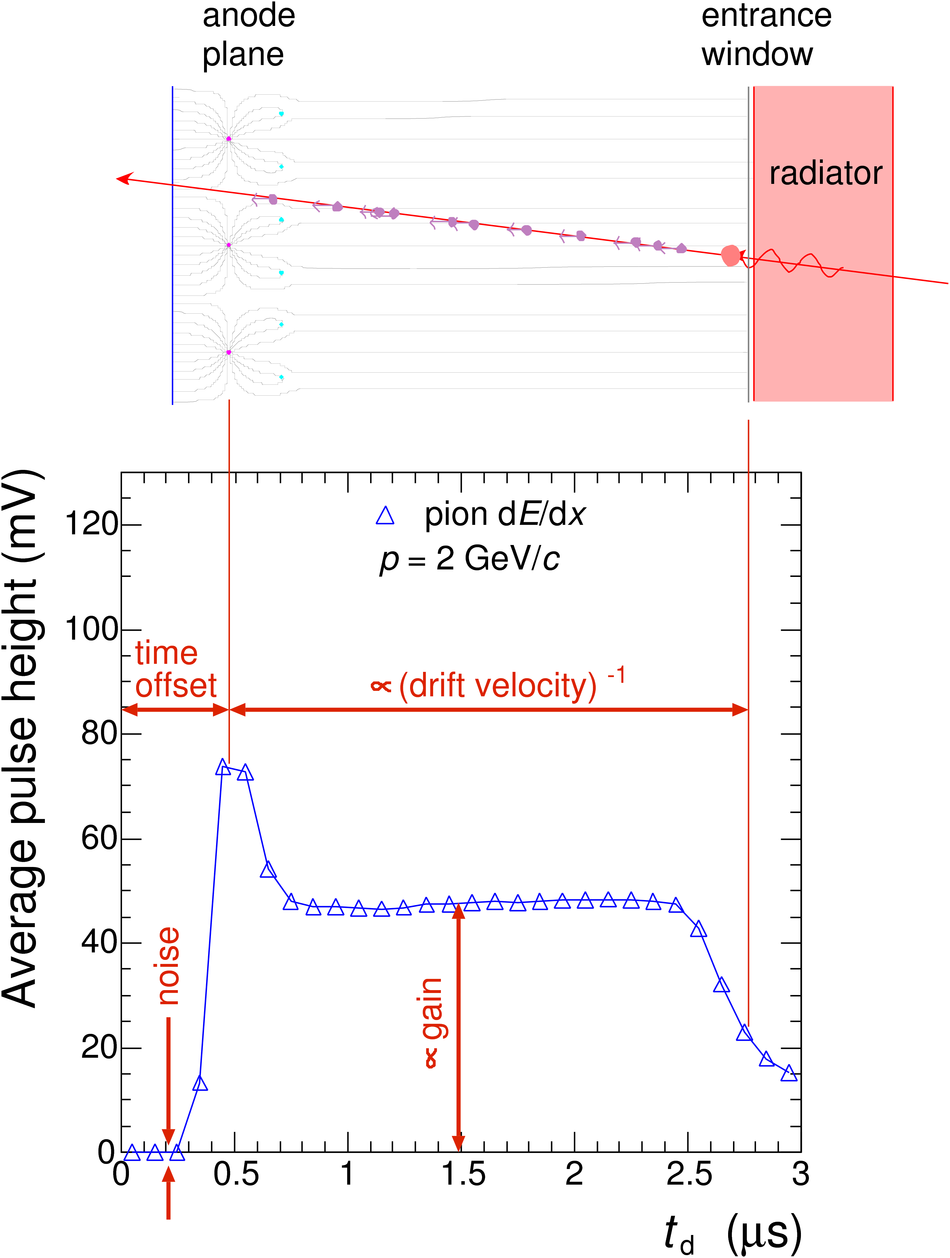 |