Ratio of \Drecoil\ distributions for events with high and low EA measured in \pPb\ collisions at $\sqrtsNN =5.02$\,TeV. Left panels: V0A 0--20\% / 50--100\%; right panels: ZNA 0--20\% / 50--100\%. Upper panels: $\rr= 0.2$; lower panels: $\rr =0.4$. The grey boxes show the systematic uncertainty of the ratio, which takes into account the correlated uncertainty of numerator and denominator The red line indicates the ratio for a \pT-shift of the high-EA distribution of $-0.4$\,\gev. |  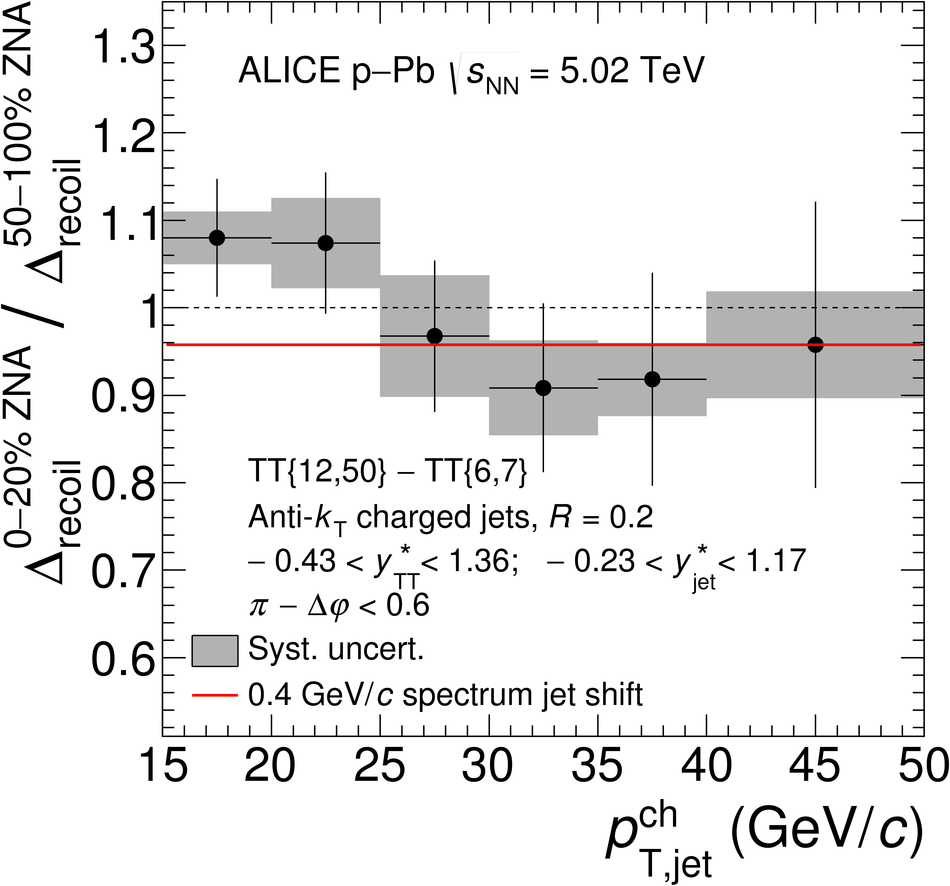 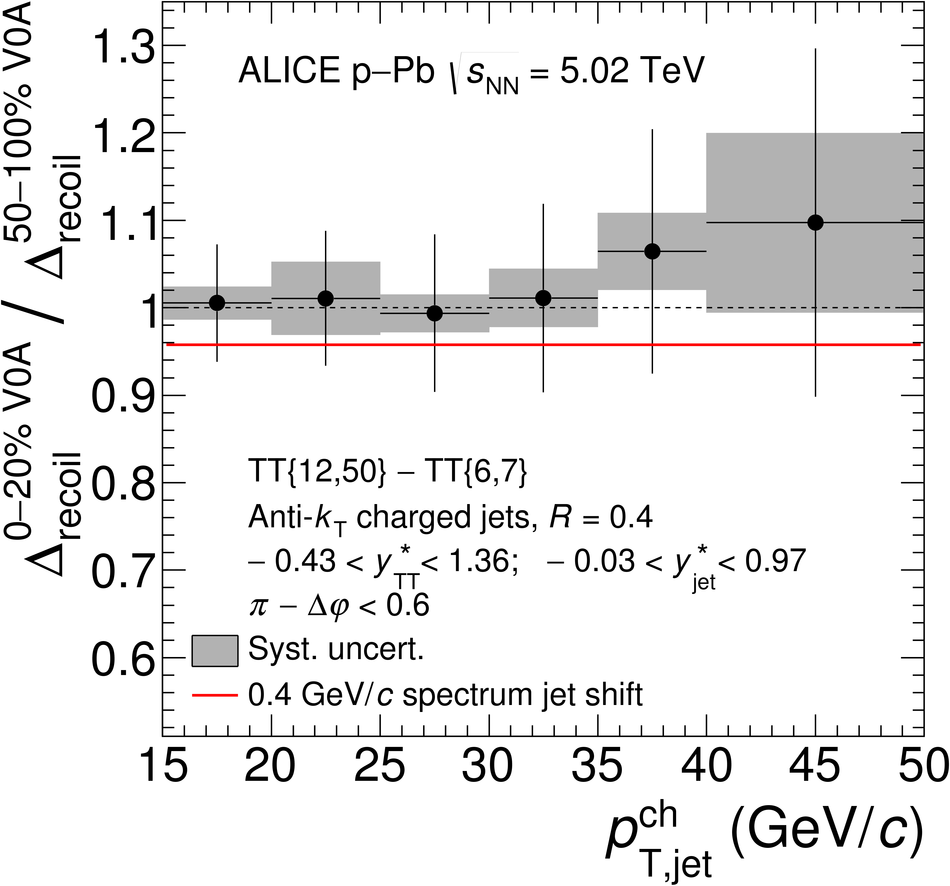 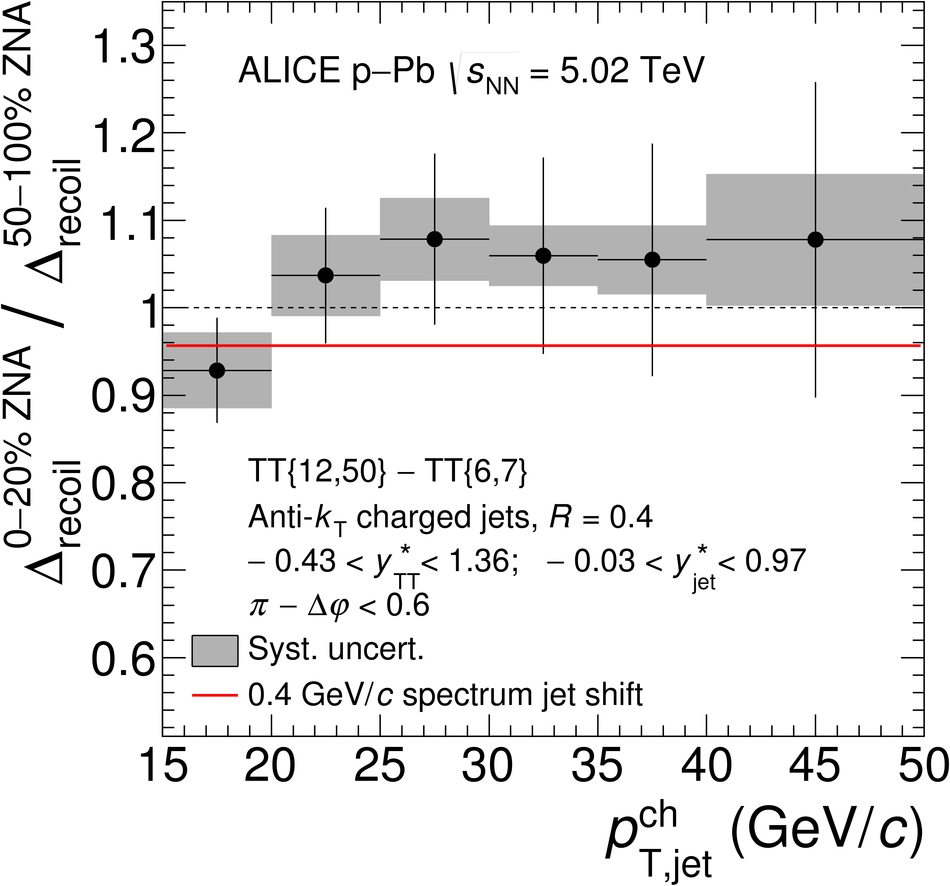 |