Distribution of event activity EA in decile bins measured in ZNA (left) and V0A (right), for the MB event population and for event populations selected with the requirement of a high-\pT\ trigger hadron in the intervals $6< \pTtrig< 7$\,\gev\ (TT\{6,7\}) and $12< \pTtrig< 50$\,\gev\ (TT\{12,50\}). Large EA is to the left, with the 0-10\% bin representing the largest EA, or highest amplitude signal in ZNA or V0A. | 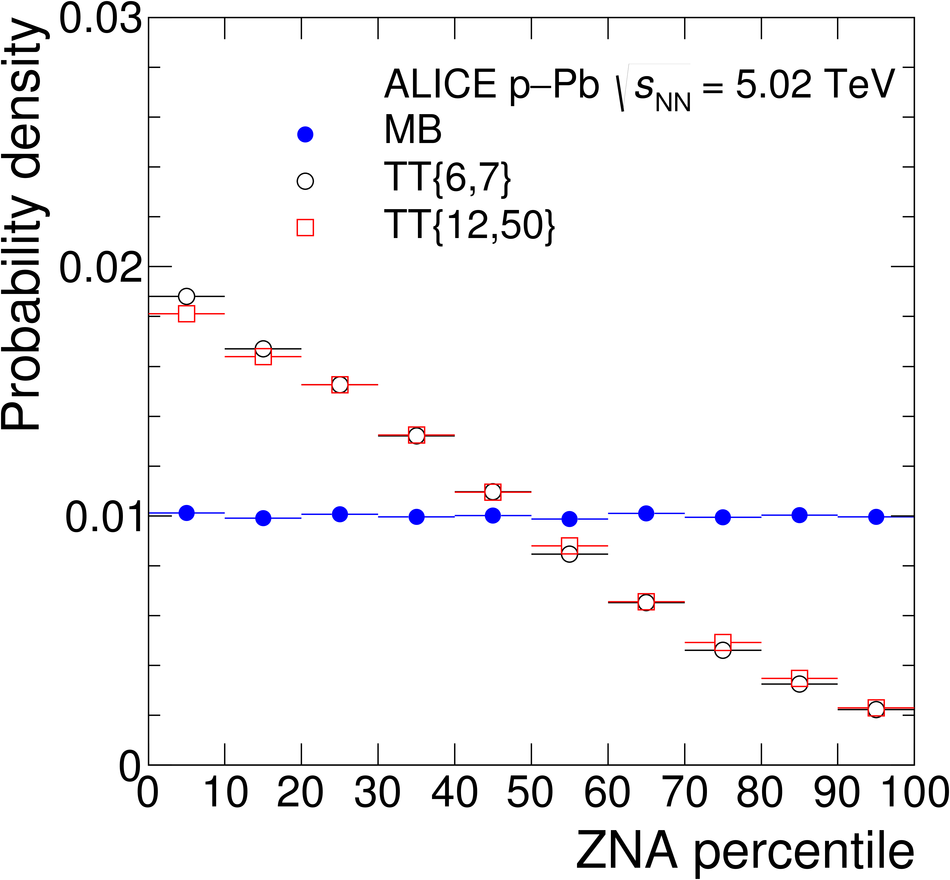 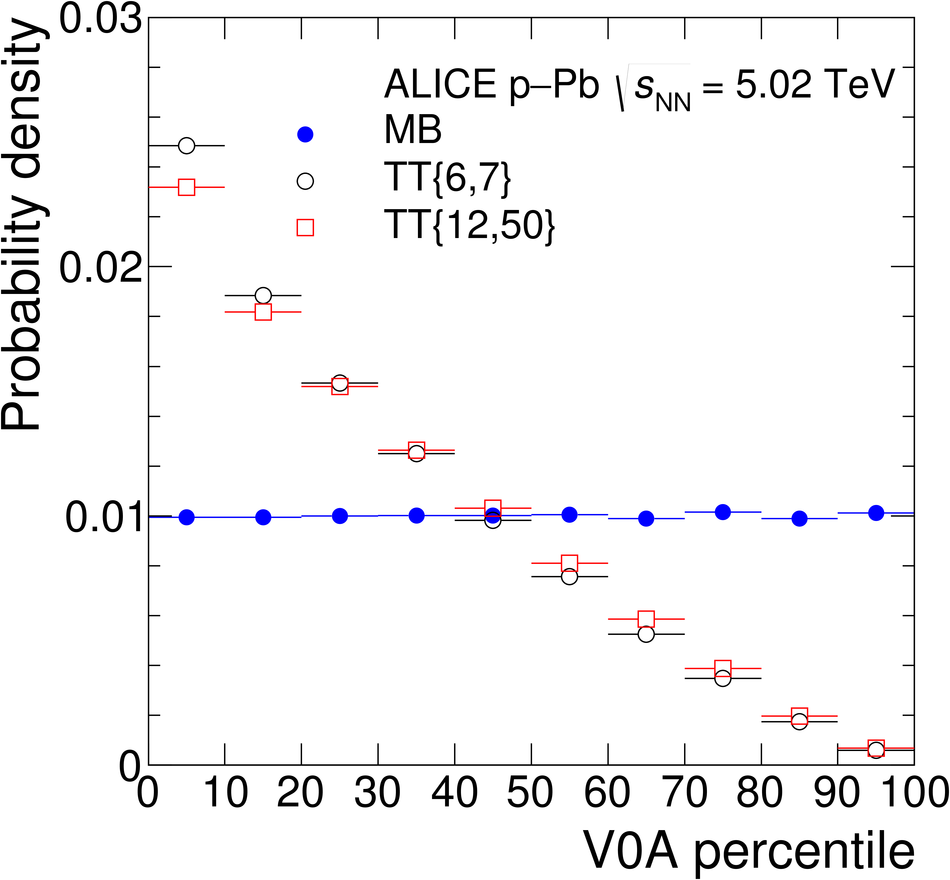 |