Schematic cross-section of a TRD chamber in the $x$-$z$ plane (perpendicular to the wires) with tracks of a pion and an electron to illustrate the ionisation energy deposition and the TR contribution. The large energy deposition due to the TR photon absorption is indicated by the large red circle in the drift region. The drift lines (solid lines) are calculated with Garfield and correspond to the nominal voltage settings for chamber operation. The radiator is not drawn to scale. | 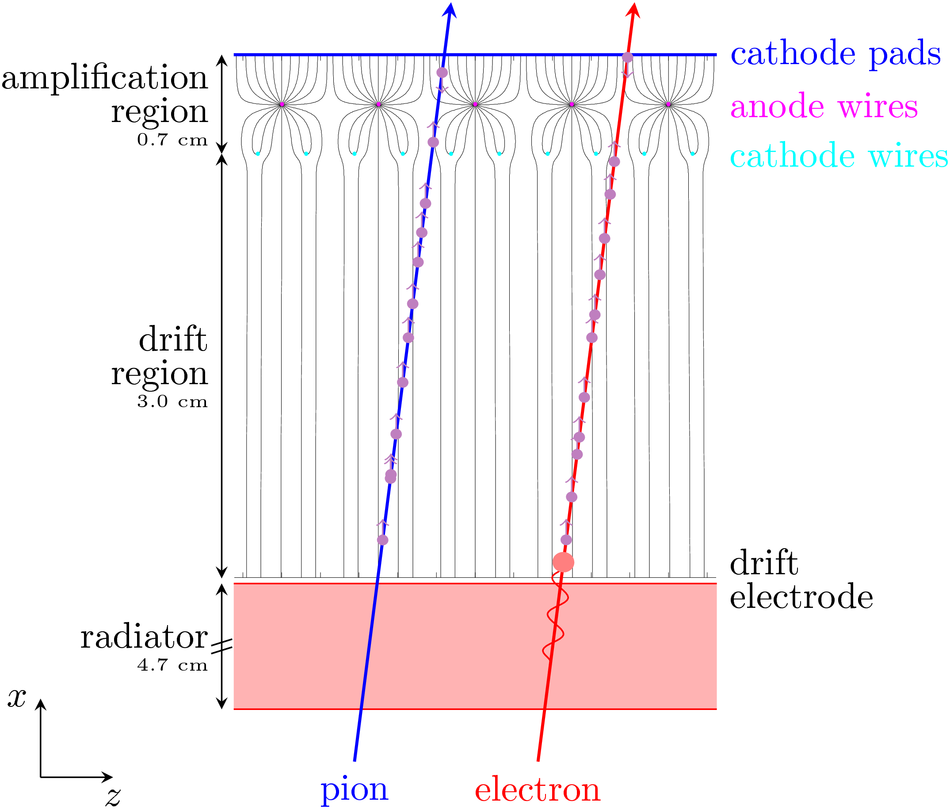 |