We present the first measurements of femtoscopic correlations between the K$^0_{\rm S}$ and K$^{\rm \pm}$ particles in pp collisions at $\sqrt{s}=7$ TeV measured by the ALICE experiment. The observed femtoscopic correlations are consistent with final-state interactions proceeding solely via the $a_0(980)$ resonance. The extracted kaon source radius and correlation strength parameters for K$^0_{\rm S}$K$^{\rm -}$ are found to be equal within the experimental uncertainties to those for K$^0_{\rm S}$K$^{\rm +}$. Results of the present study are compared with those from identical-kaon femtoscopic studies also performed with pp collisions at $\sqrt{s}=7$ TeV by ALICE and with a K$^0_{\rm S}$K$^{\rm \pm}$ measurement in Pb-Pb collisions at $\sqrt{s_{\rm NN}}=2.76$ TeV. Combined with the Pb-Pb results, our pp analysis is found to be compatible with the interpretation of the $a_0(980)$ having a tetraquark structure instead of that of a diquark.
Phys. Lett. B 790 (2019) 22
HEP Data
e-Print: arXiv:1809.07899 | PDF | inSPIRE
CERN-EP-2018-234
Figure 3
Correlation functions divided by one of the baseline functions with fits from Eq. (\ref{eq:corrfit}) for K$^0_{\rm S}$K$^+$ and K$^0_{\rm S}$K$^-$ and $k^*$ fit range (0.0-0.6 GeV/$c$) for the three $k_T$ bins and the quadratic baseline function assumption. Statistical (lines) and the quadratic sum of the statistical and systematic (boxes) uncertainties are shown. For $k^*>0.05$ GeV/$c$, the systematic uncertainties become negligible and the boxes are no longer shown. | 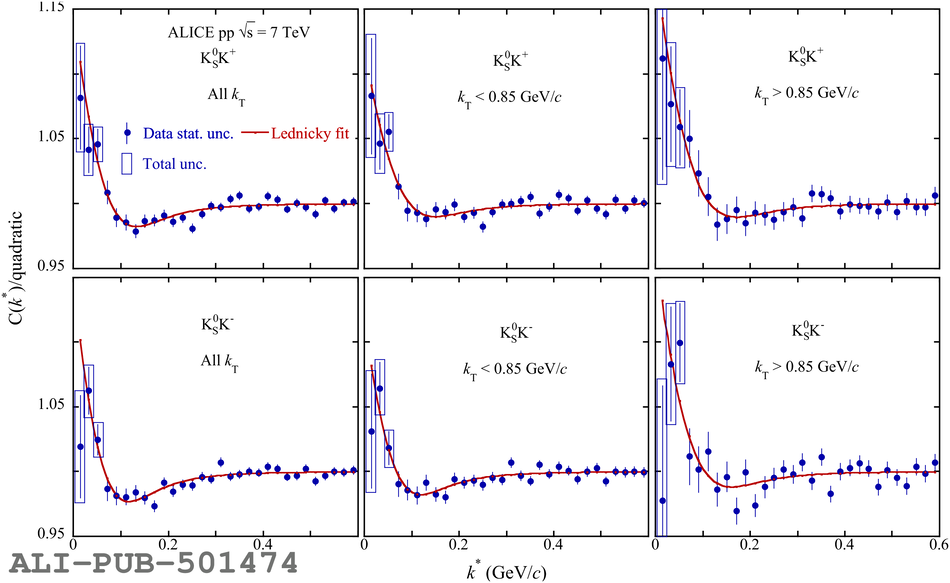 |
Figure 5
$R$ and $\lambda$ parameters extracted in the present analysis from K$^0_{\rm S}$K$^{\rm \pm}$ femtoscopy averaged over K$^0_{\rm S}$K$^+$ and K$^0_{\rm S}$K$^-$, along witha comparison with K$^0_{\rm S}$K$^{\rm \pm}$ results from ALICE 2.76 TeV Pb-Pb collisions for $0-10$\% centrality The quadratic sum of the statistical and systematic uncertainties is plotted for all results as boxes andthe statistical uncertainties are given as lines. The $\lambda$ parameters have been dividedby their respective pair purities to facilitate their comparison. | 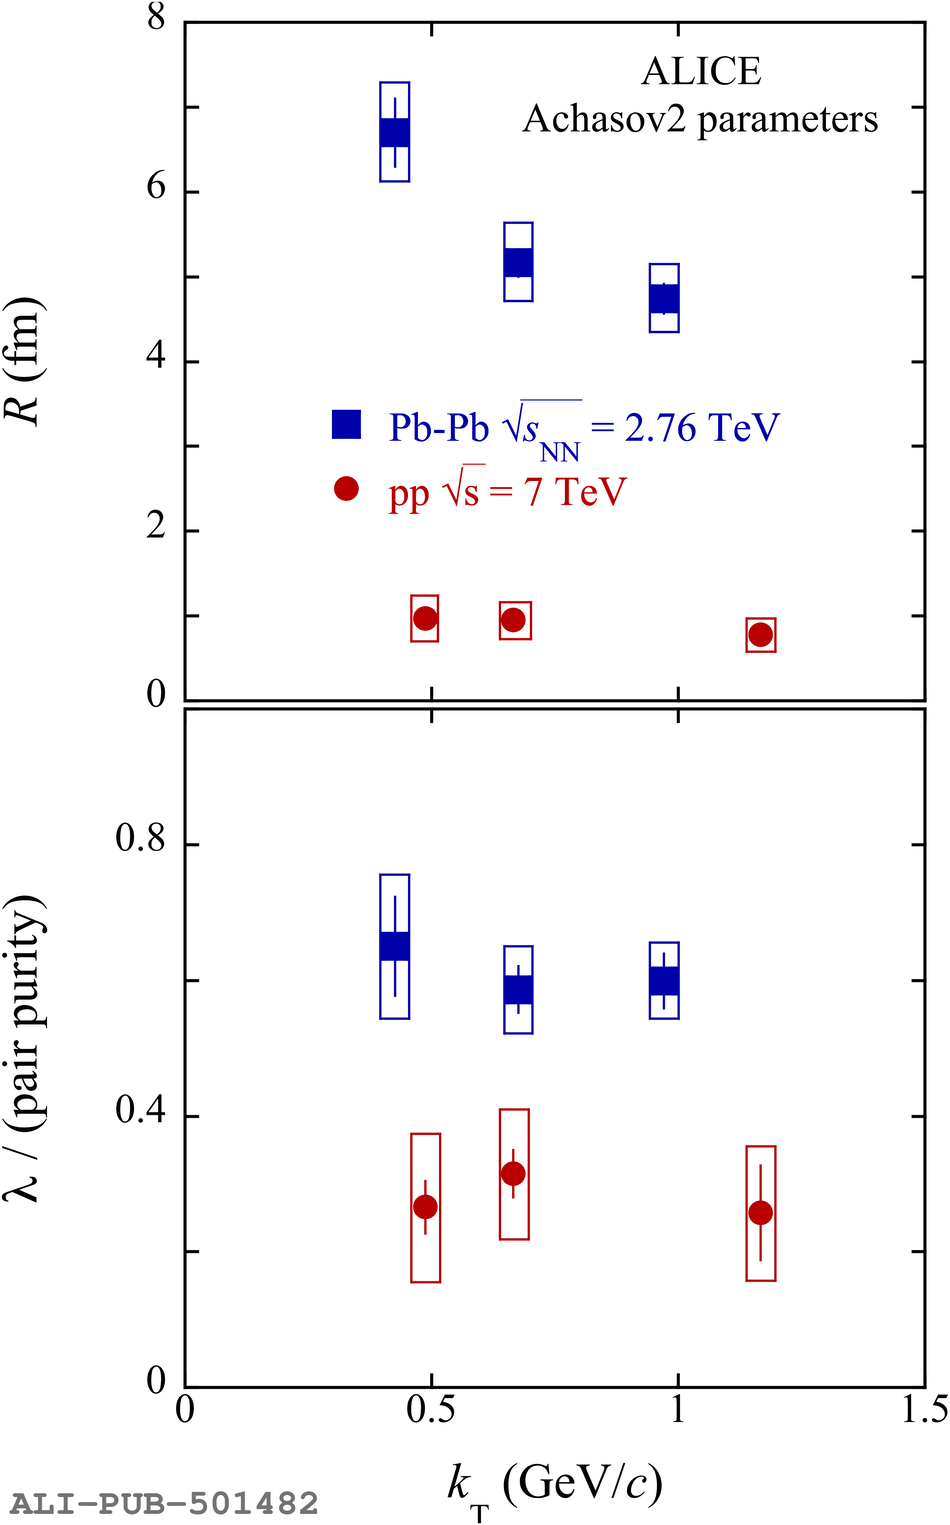 |
Figure 6
$R$ and purity-normalized $\lambda$ parameters extracted in the present analysis from K$^0_{\rm S}$K$^{\rm \pm}$ femtoscopy averaged over K$^0_{\rm S}$K$^+$ and K$^0_{\rm S}$K$^-$, along withcomparisons with identical kaon results from ALICE 7 TeV pp collisions averaged overevent multiplicity The quadratic sum of the statistical and systematic uncertainties is plotted for all results as boxes andthe statistical uncertainties are given as lines. Also plotted as a blue dashed lineis the simple average of the identical-kaon purity-normalized $\lambda$ parameters. | 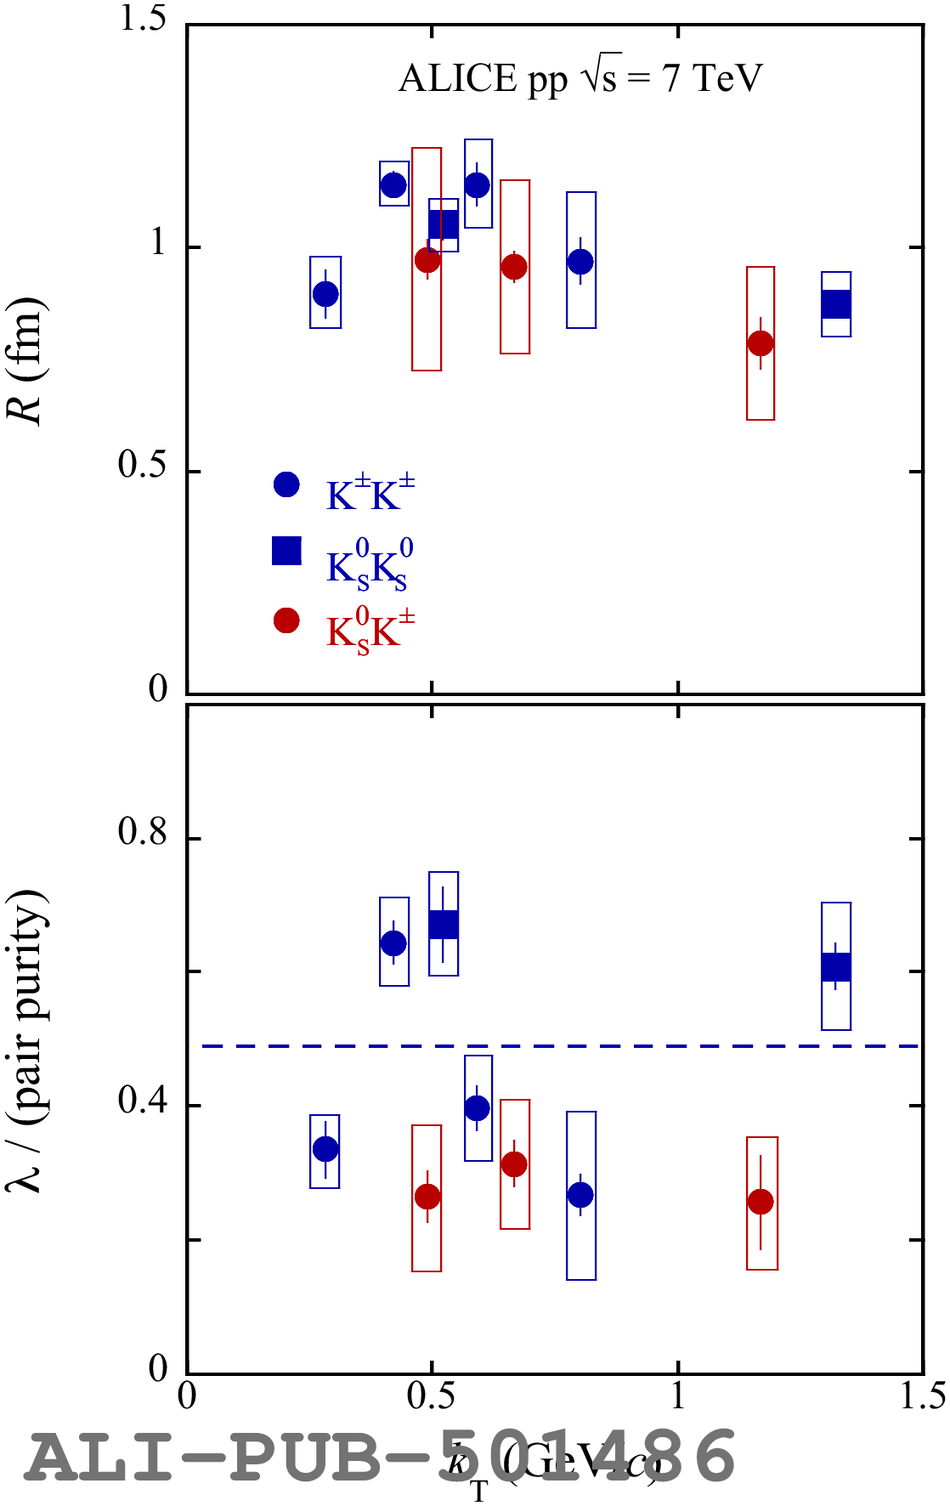 |