The left plots show reconstructed $\pi^{0}$ peak positions (left-bottom) and widths (left-top) of each reconstruction method compared to MC simulations for the transverse momentum bins used in the analysis. Corresponding plots for the $\eta$ meson are on the right for peak masses (right-bottom) and widths (right-top). | 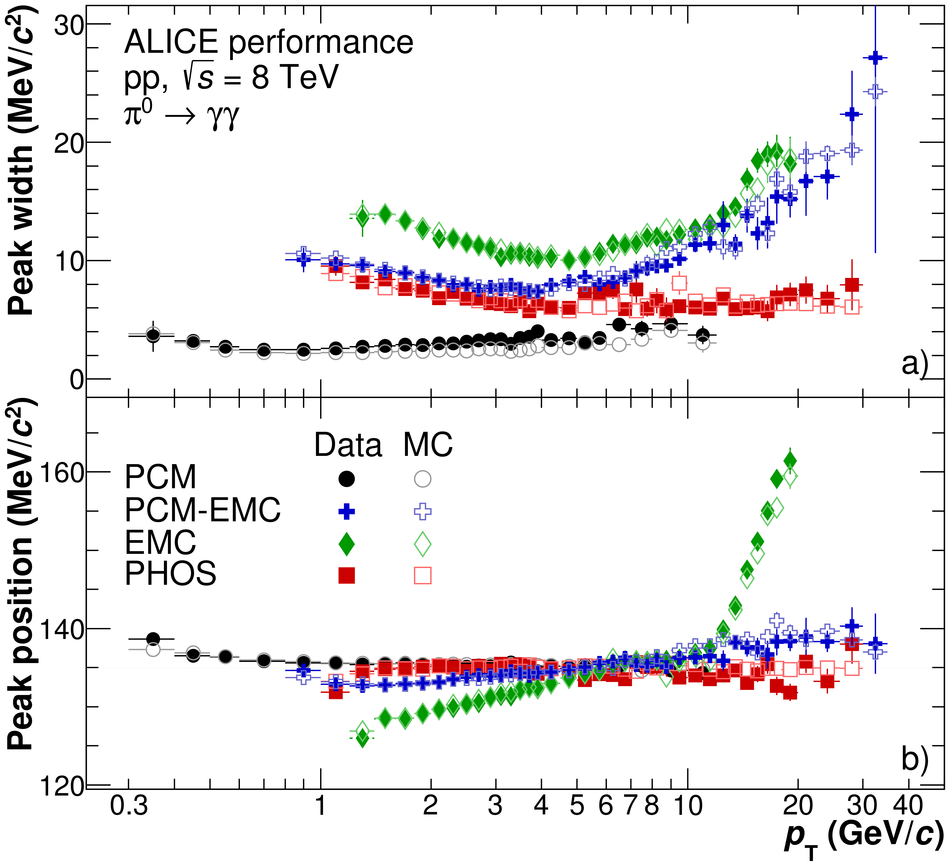 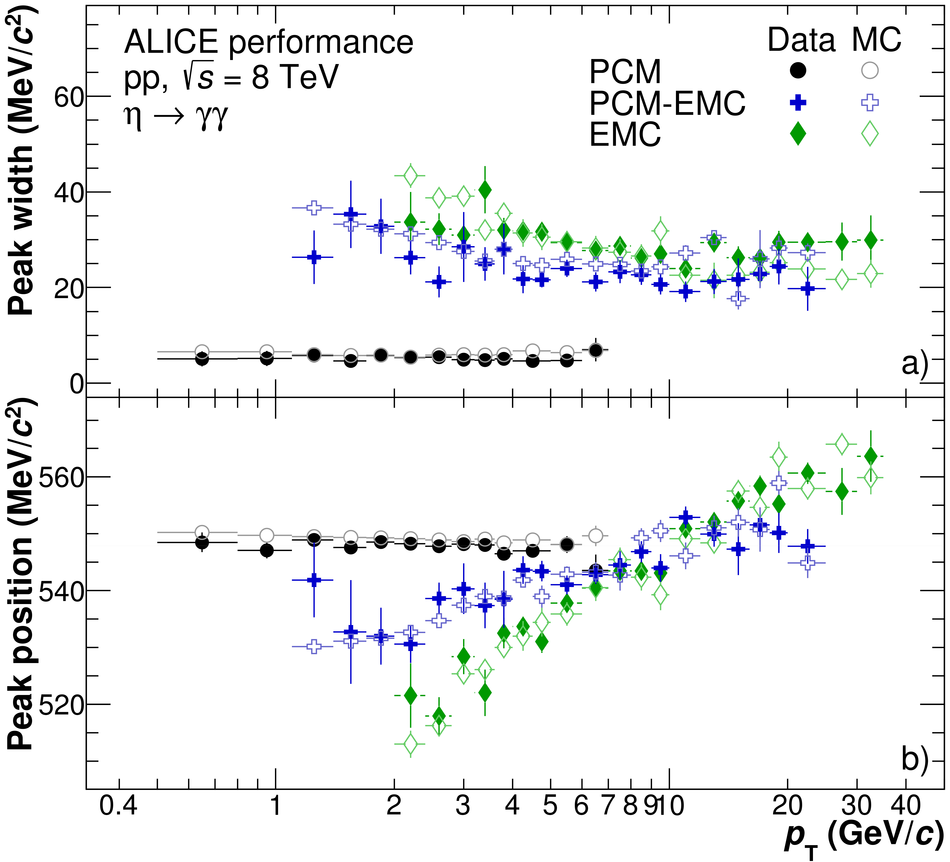 |