Charged-particle spectra at midrapidity are measured in Pb-Pb collisions at the centre-of-mass energy per nucleon-nucleon pair $\sqrt{s_{\rm NN}}$ = 5.02 TeV and presented in centrality classes ranging from most central (0-5%) to most peripheral (95-100%) collisions. Possible medium effects are quantified using the nuclear modification factor ($R_{\rm AA}$) by comparing the measured spectra with those from proton-proton collisions, scaled by the number of independent nucleon-nucleon collisions obtained from a Glauber model. At large transverse momenta ($8<~p_{\rm T}<~20$ GeV/$c$), the average $R_{\rm AA}$ is found to increase from about $0.15$ in 0-5% central to a maximum value of about $0.8$ in 75-85% peripheral collisions, beyond which it falls off strongly to below $0.2$ for the most peripheral collisions. Furthermore, $R_{\rm AA}$ initially exhibits a positive slope as a function of $p_{\rm T}$ in the $8$-$20$ GeV/$c$ interval, while for collisions beyond the 80% class the slope is negative. To reduce uncertainties related to event selection and normalization, we also provide the ratio of $R_{\rm AA}$ in adjacent centrality intervals. Our results in peripheral collisions are consistent with a PYTHIA-based model without nuclear modification, demonstrating that biases caused by the event selection and collision geometry can lead to the apparent suppression in peripheral collisions. This explains the unintuitive observation that $R_{\rm AA}$ is below unity in peripheral Pb-Pb, but equal to unity in minimum-bias p-Pb collisions despite similar charged-particle multiplicities.
Phys.Lett. B793 (2019) 420-432
HEP Data
e-Print: arXiv:1805.05212 | PDF | inSPIRE
CERN-EP-2018-115
Figure 2
Nuclear-modification factor versus \pT\ for charged particles at midrapidity in \PbPb\ collisions at $\snn=5.02$ TeV for 5\%-wide centrality classes The filled, coloured markers are for the five most peripheral classes, with the corresponding global uncertainties denoted close to $\pt = 0.1$ \gevc Vertical error bars denote statistical uncertainties, while the boxes denote the systematic uncertainties. For visibility, the uncertainties are only drawn for the peripheral classes. | 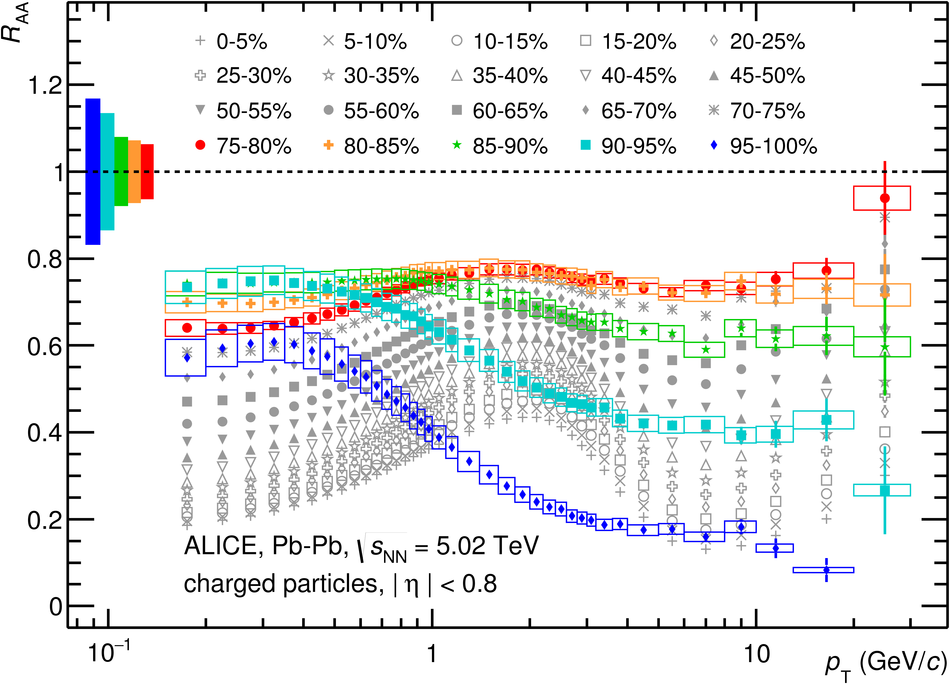 |
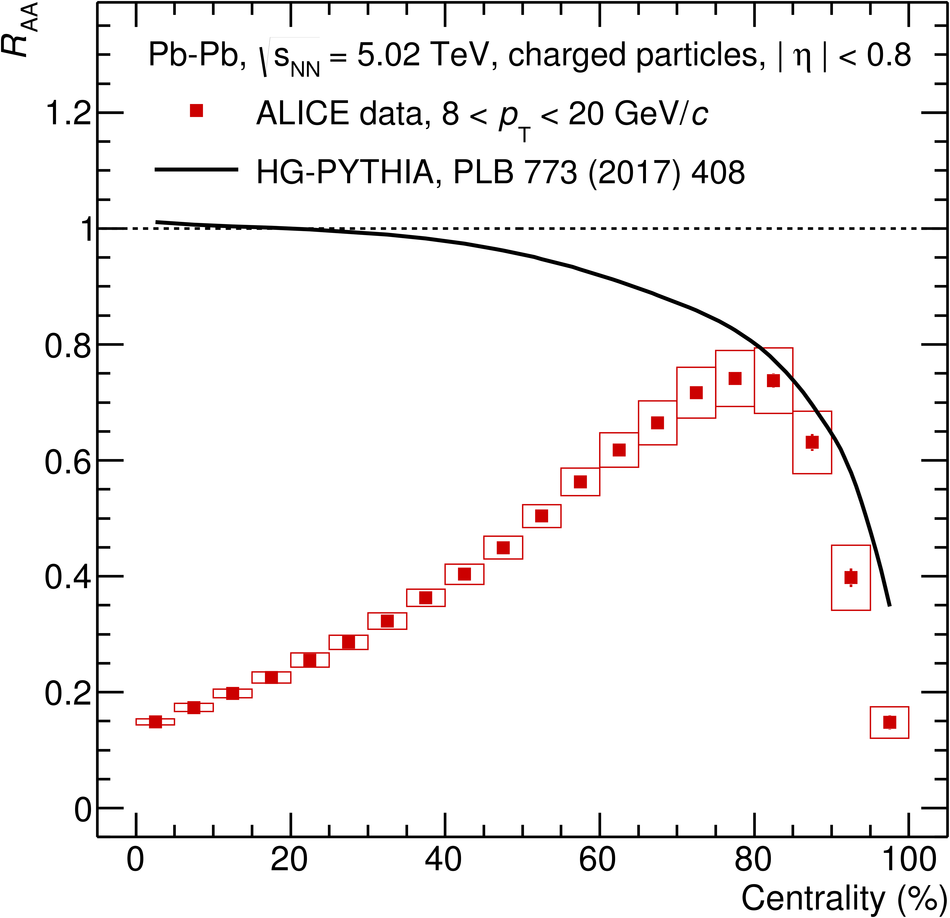
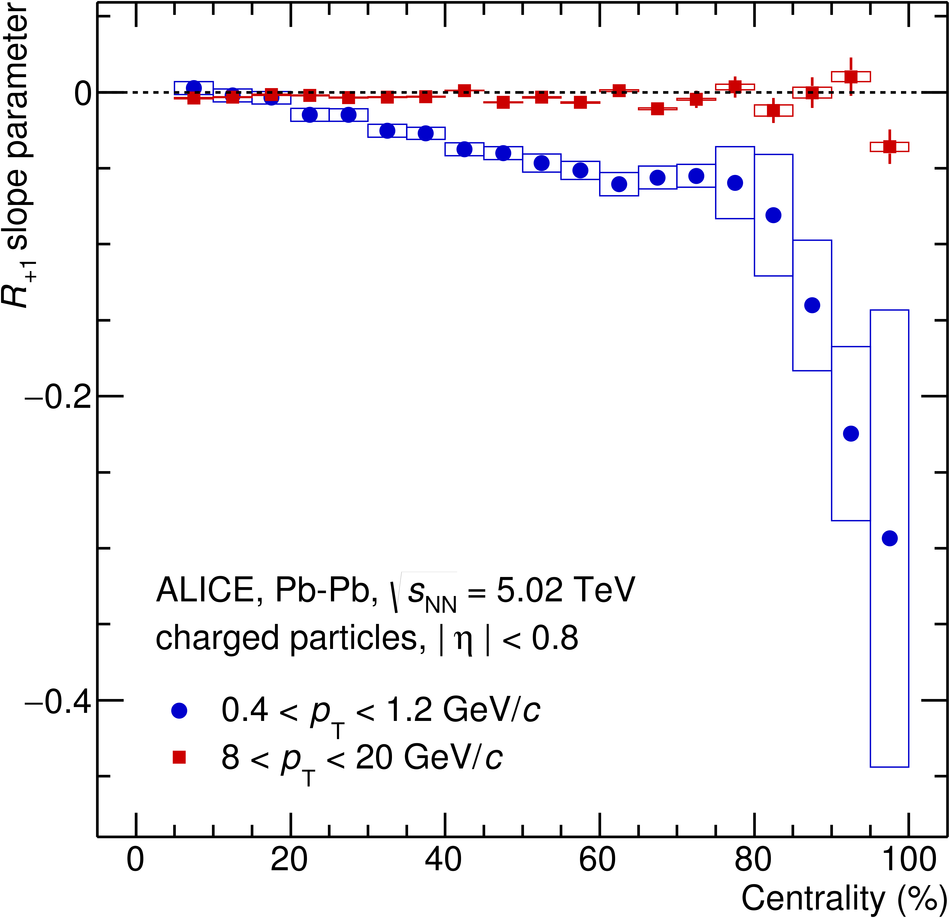
Figure 4
Slope of $\RAA$ at low $\pT$ (in $0.4< \pT< 1.2$ \gevc) and at high $\pT$ (in $8< \pT< 20$ \gevc) scaled by factor 15 for visibility versus centrality percentile in \PbPb\ collisions at $\snn=5.02$ TeV. Vertical error bars denote statistical uncertainties, while the boxes denote the systematic uncertainties. | 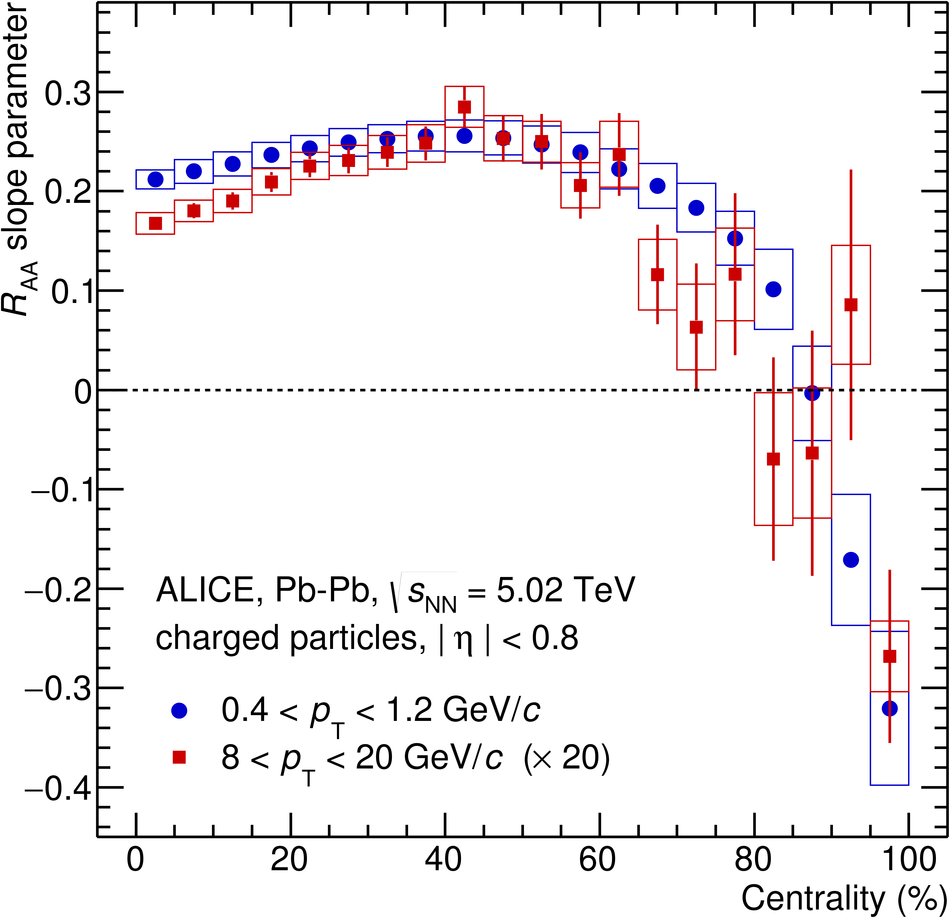 |
Figure 5
$\RPO$\ versus \pT\ for charged particles at midrapidity in \PbPb\ collisions at $\snn=5.02$ TeV. $\RPO$\ is defined as the ratio of $\Ncoll$ normalized spectra for a given centrality class relative to the 5\% more central class, see \Eq{eq:rpo} The filled, coloured markers are for the 5 most peripheral classes, with the corresponding global uncertainties denoted close to $\pt = 0.1$ \gevc\ on the \pt-axis Vertical error bars denote statistical uncertainties, while the boxes denote the systematic uncertainties. For visibility, the uncertainties are only drawn for the peripheral classes. | 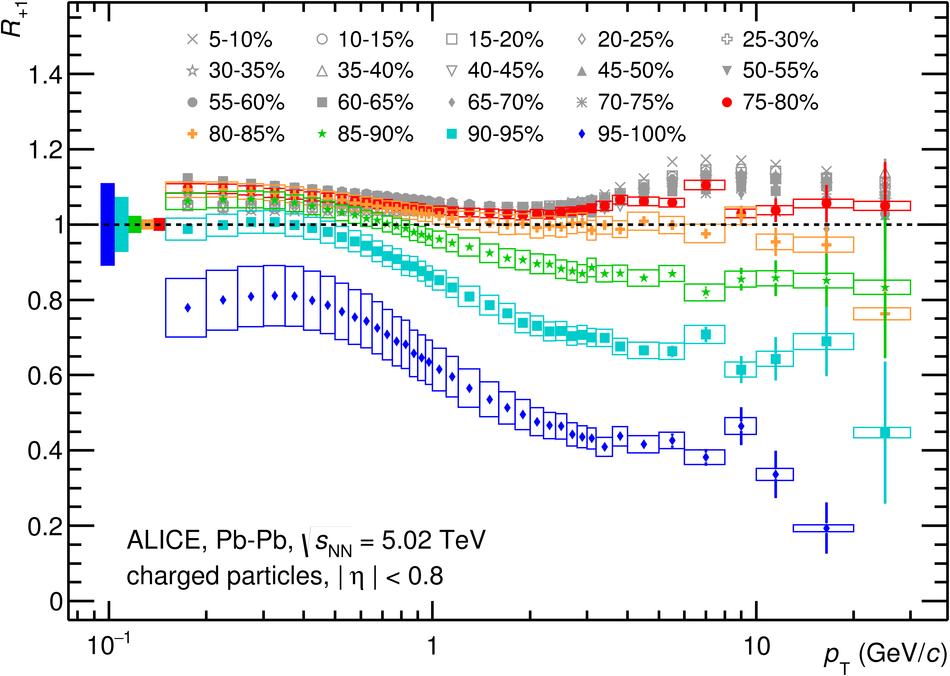 |