Transverse momentum ($p_{\rm T}$) spectra of charged particles at mid-pseudorapidity in Xe-Xe collisions at $\sqrt{s_{\rm NN}}$ = 5.44 TeV measured with the ALICE apparatus at the Large Hadron Collider are reported. The kinematic range $0.15 <~ p_{\rm T} <~ 50$ GeV/$c$ and $|\eta| <~ 0.8$ is covered. Results are presented in nine classes of collision centrality in the 0-80% range. For comparison, a pp reference at the collision energy of $\sqrt{s}$ = 5.44 TeV is obtained by interpolating between existing \pp measurements at $\sqrt{s}$ = 5.02 and 7 TeV. The nuclear modification factors in central Xe-Xe collisions and Pb-Pb collisions at a similar center-of-mass energy of $\sqrt{s_{\rm NN}}$ = 5.02 TeV, and in addition at 2.76 TeV, at analogous ranges of charged particle multiplicity density $\left\langle\rm{d}N_{\rm ch}/\rm{d}\eta\right\rangle$ show a remarkable similarity at $p_{\rm T}> 10$ GeV/$c$. The centrality dependence of the ratio of the average transverse momentum $\left\langle p_{\rm{T}}\right\rangle$ in Xe-Xe collisions over Pb-Pb collision at $\sqrt{s}$ = 5.02 TeV is compared to hydrodynamical model calculations.
Phys. Lett. B 788 (2019) 166-179
HEP Data
e-Print: arXiv:1805.04399 | PDF | inSPIRE
CERN-EP-2018-112

Figure 4
Nuclear modification factor in \xexe at \sqrsn = 5.44 \tev (filled circles) and \pbpb collisions at \sqrsn = 5.02 \tev (open circles) for nine centrality classes. The vertical lines (brackets) represent the statistical (systematic) uncertainties. The overall normalization uncertainty is shown as a filled box around unity. | 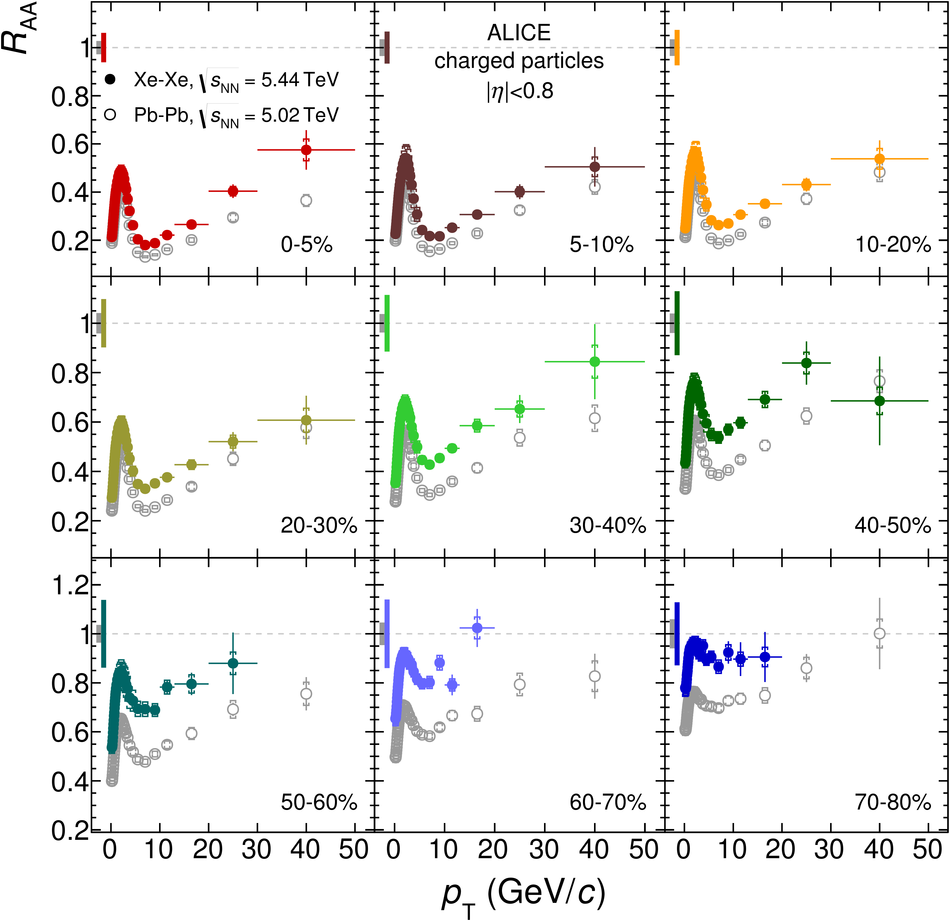 |
Figure 5
Comparison of nuclear modification factors in \xexe collisions (filled circles) and \pbpb collisions (open circles) for similar ranges in \avg{\dnchdeta} for the 0--5\% (left) and 30--40\% (right) \xexe centrality classes. The vertical lines (brackets) represent the statistical (systematic) uncertainties. | 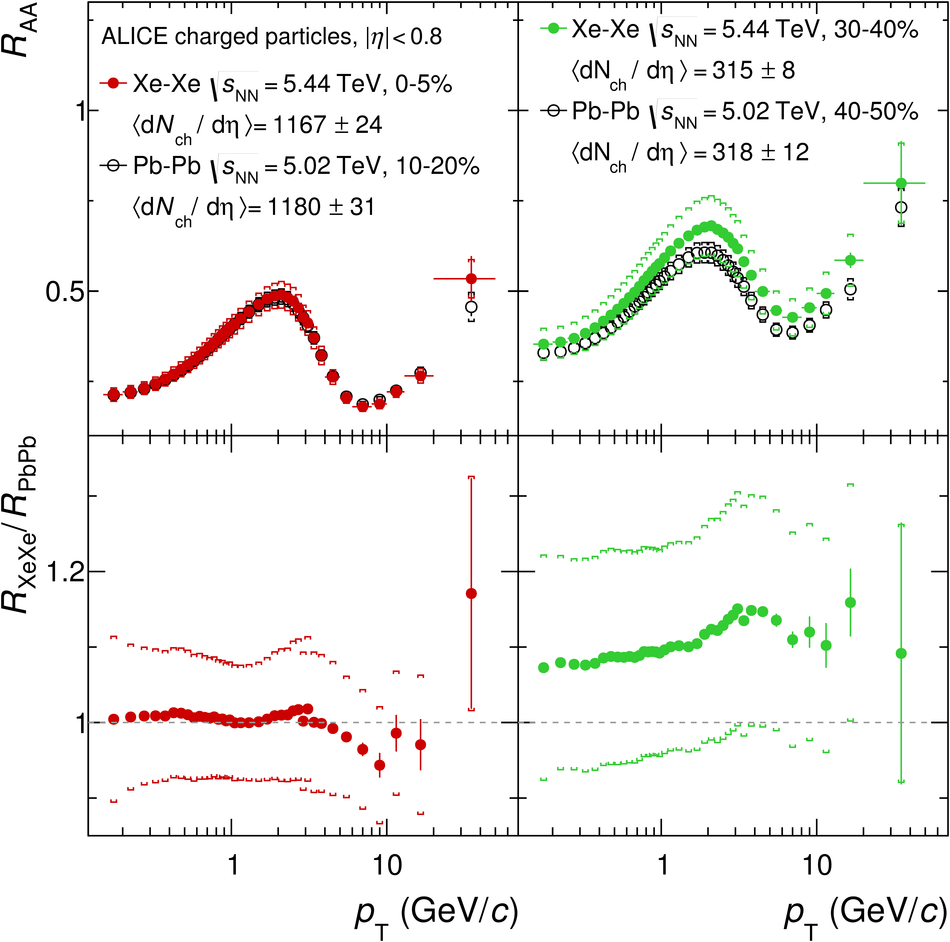 |
Figure 6
Comparison of the nuclear modification factor in \xexe and \pbpb collisions integrated over identical regions in \pt as a function of \avg{\dnchdeta}. The vertical brackets indicate the quadratic sum of the total systematic uncertainty in the measurement and the overall normalization uncertainty in \avTAA.The horizontal bars reflect the RMS of the distribution in each bin. The dashed lines show results from power-law fits to the data and are drawn to guide the eye. | 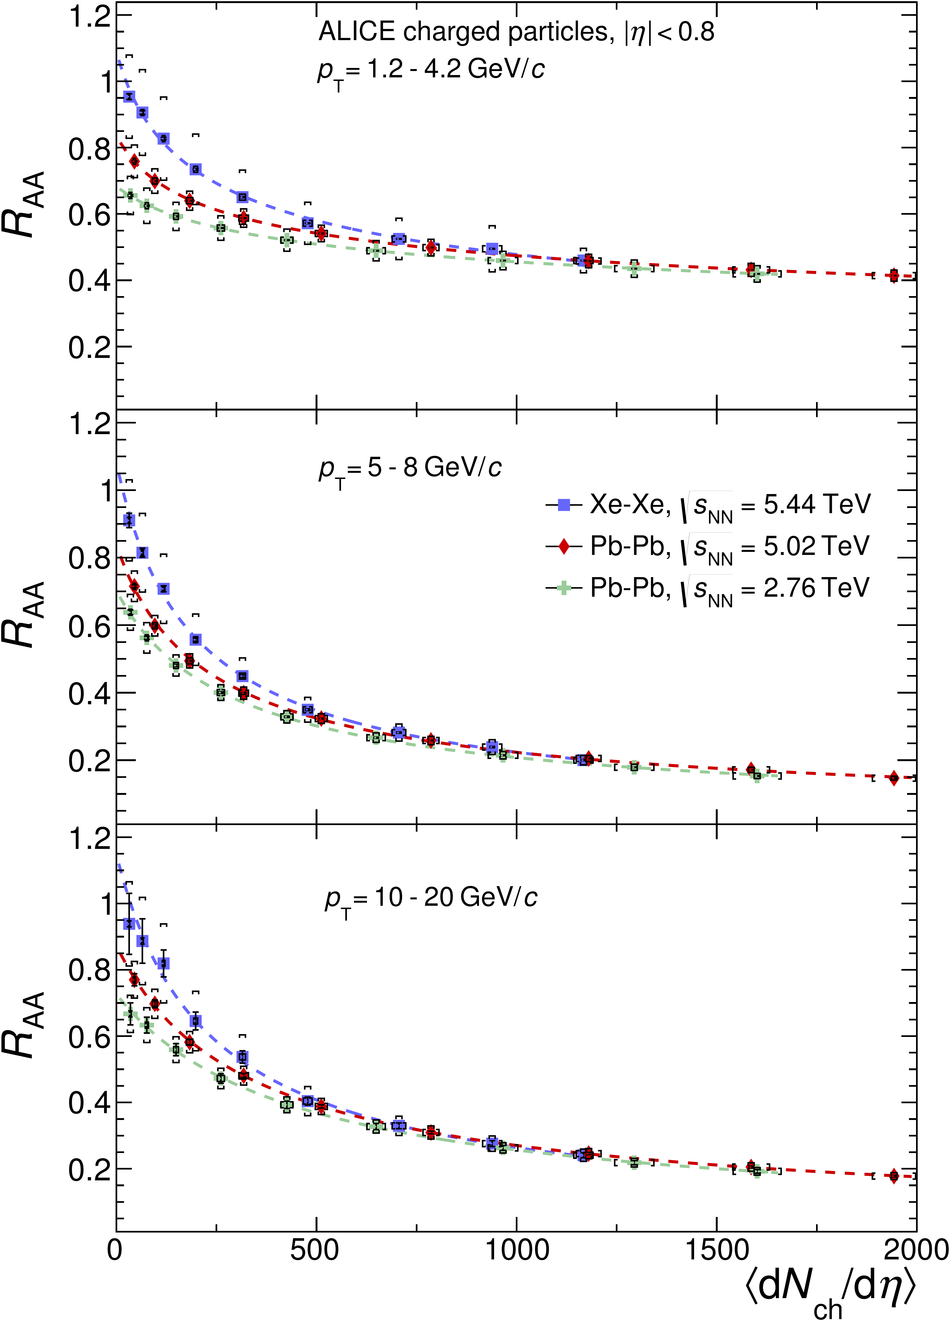 |
Figure 7
Average transverse momentum in the \pt-range 0--10 \gevc for \xexe collisions at \sqrs = 5.44 \tev (squares) and \pbpb collisions at \sqrs = 5.02 \tev (diamonds) for nine centrality classes (top) and their ratios (bottom). The vertical brackets indicate systematic uncertainties. The hashed areas show results from hydrodynamical calculations by Giacalone et al. . | 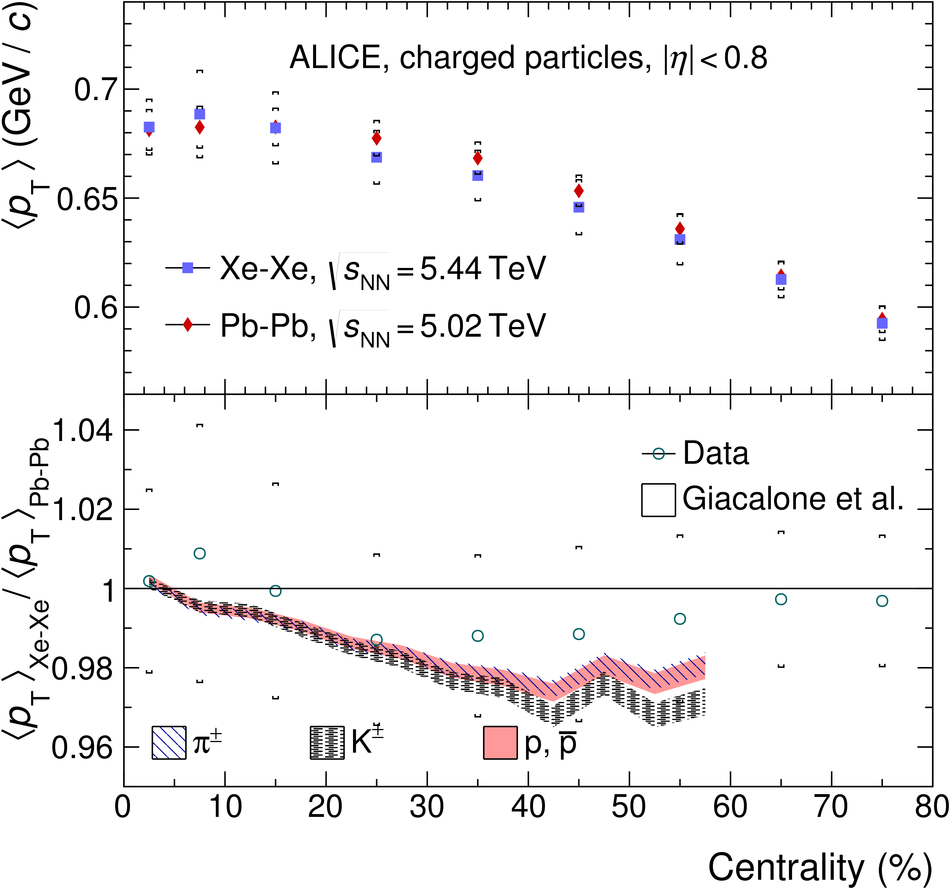 |