Inclusive J/$ψ$ production at forward and backward rapidity in p-Pb collisions at $\sqrt{s_{\rm NN}}$ = 8.16 TeV

Inclusive J/$\psi$ production is studied in p-Pb interactions at a centre-of-mass energy per nucleon-nucleon collision $\sqrt{s_{\rm NN}}=8.16$ TeV, using the ALICE detector at the CERN LHC. The J/$\psi$ meson is reconstructed, via its decay to a muon pair, in the centre-of-mass rapidity intervals $2.03<~y_{\rm {cms}}<~3.53$ and $-4.46<~y_{\rm {cms}}<~-2.96$, where positive and negative $y_{\rm {cms}}$ refer to the p-going and Pb-going direction, respectively. The transverse momentum coverage is $p_{\rm T}<~20$ GeV/$c$. In this paper, $y_{\rm cms}$- and $p_{\rm T}$-differential cross sections for inclusive J/$\psi$ production are presented, and the corresponding nuclear modification factors $R_{\rm pPb}$ are shown. Forward results show a suppression of the J/$\psi$ yield with respect to pp collisions, concentrated in the region $p_{\rm T}\lesssim 5$ GeV/$c$. At backward rapidity no significant suppression is observed. The results are compared to previous measurements by ALICE in p-Pb collisions at $\sqrt{s_{\rm NN}}=5.02$ TeV and to theoretical calculations. Finally, the ratios $R_{\rm FB}$ between forward- and backward-$y_{\rm {cms}}$ $R_{\rm pPb}$ values are shown and discussed.


JHEP 07 (2018) 160
HEP Data
e-Print: arXiv:1805.04381 | PDF | inSPIRE

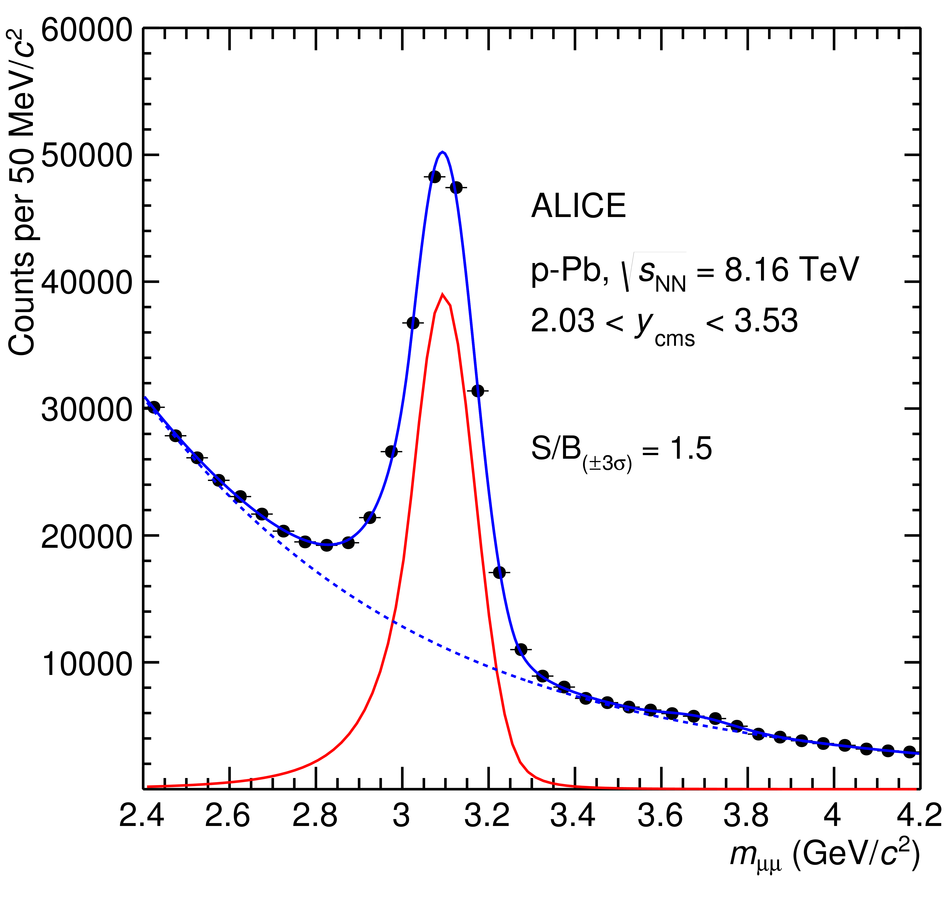
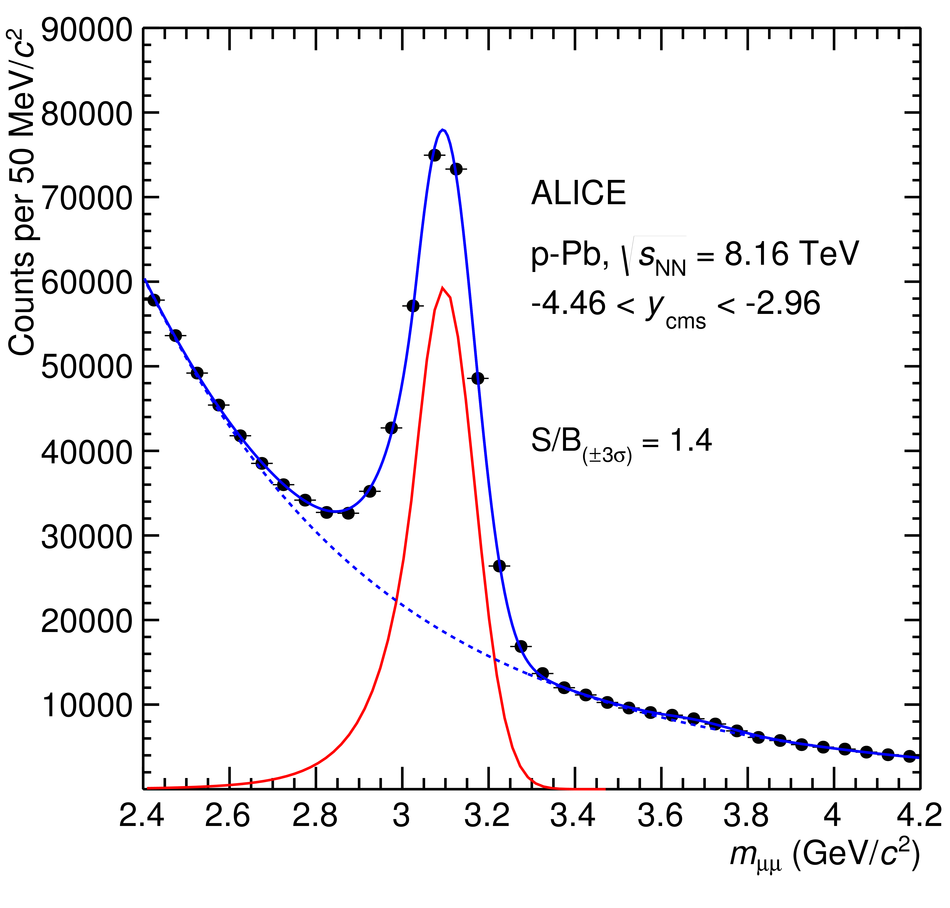
Figure 1

Fits to the invariant mass distributions of opposite-sign dimuons with $p_{\rm T}< 20$ GeV/$c$. The left plot refers to $2.03< y_{\rm {cms}}< 3.53$, and that on the right to $-4.46< y_{\rm {cms}}< -2.96$. The shapes of both the resonances and the background are also shown.

Figure 2

The $y$-differential inclusive J/$\psi$ production cross section in \mbox{p--Pb} and \mbox{Pb--p} collisions at $\sqrt{s_{\rm NN}}=8.16$ TeV. The vertical error bars (not visible because smaller than the symbols) represent the statistical uncertainties, the boxes around the points the systematic uncertainties. The horizontal bars correspond to the bin size. The values of the reference pp cross sections, obtained through the interpolation/extrapolation procedure described in Sec. 3, scaled by $A_{\rm Pb}$, are shown as bands.

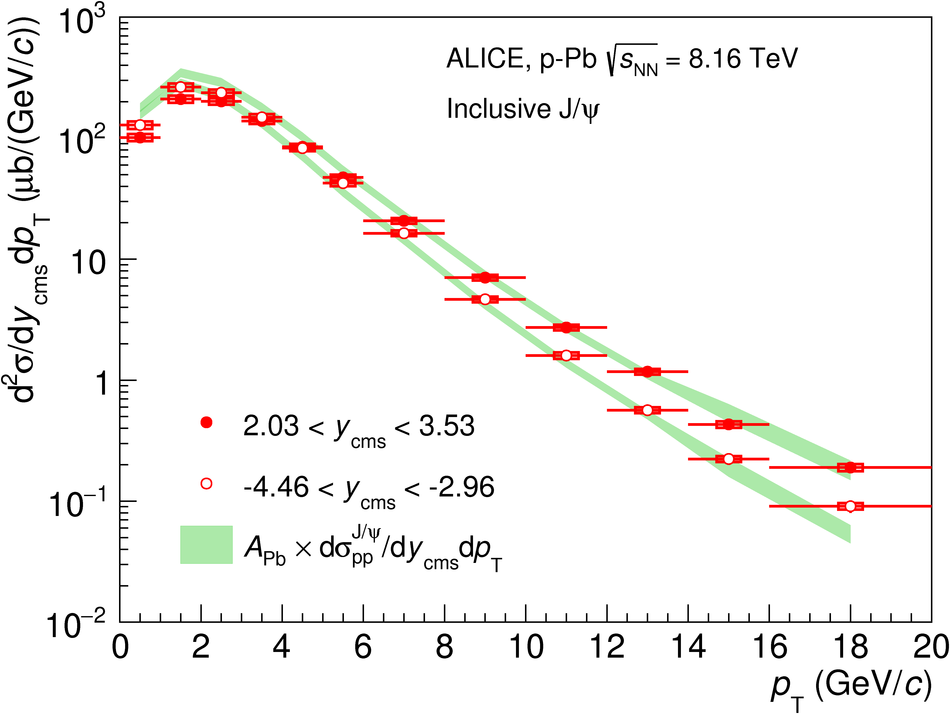
Figure 3

The $p_{\rm T}$-differential inclusive J/$\psi$ production cross section in \mbox{p--Pb} and \mbox{Pb--p} collisions at $\sqrt{s_{\rm NN}}=8.16$ TeV. The vertical error bars (not visible because smaller than the symbols) represent the statistical uncertainties, the boxes around the points the systematic uncertainties. The horizontal bars correspond to the bin size. The values of the reference pp cross sections, obtained through the interpolation/extrapolation procedure described in Sec. 3, scaled by $A_{\rm Pb}$, are shown as bands.

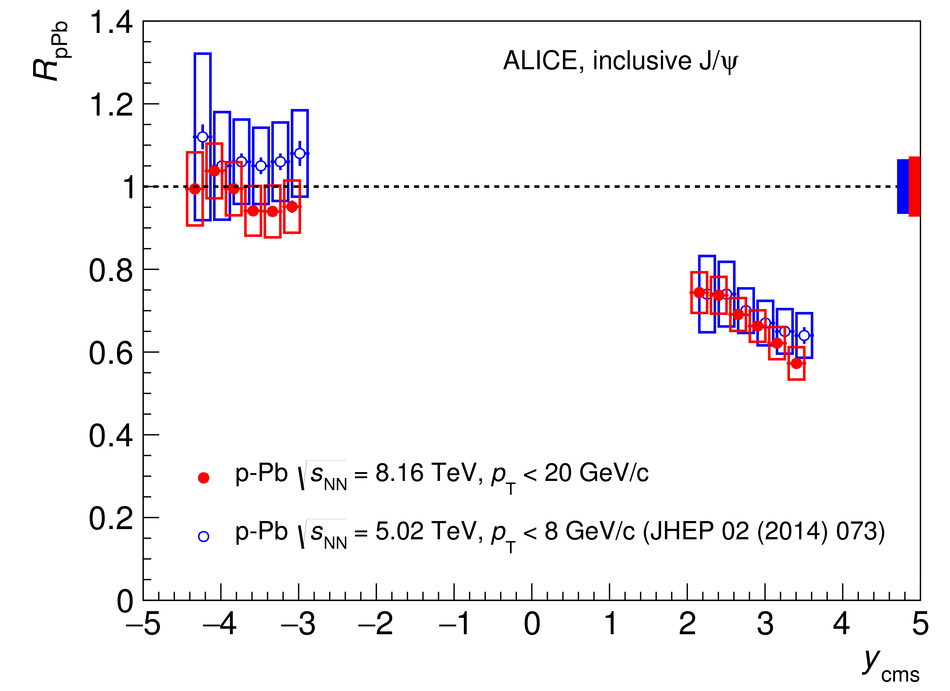
Figure 4

The inclusive J/$\psi$ nuclear modification factor in \mbox{p--Pb} and \mbox{Pb--p} collisions at $\sqrt{s_{\rm NN}}=8.16$ TeV, as a function of $y_{\rm {cms}}$. The horizontal bars correspond to the bin size. The vertical error bars represent the statistical uncertainties, the boxes around the points the uncorrelated systematic uncertainties. Correlated uncertainties are shown as a filled box around unity for each energy. The results are compared with those for \mbox{p--Pb} and \mbox{Pb--p} collisions at $\sqrt{s_{\rm NN}}=5.02$ TeV . The latter have been plotted at slightly shifted $y_{\rm cms}$ values, for better visibility.

Figure 5

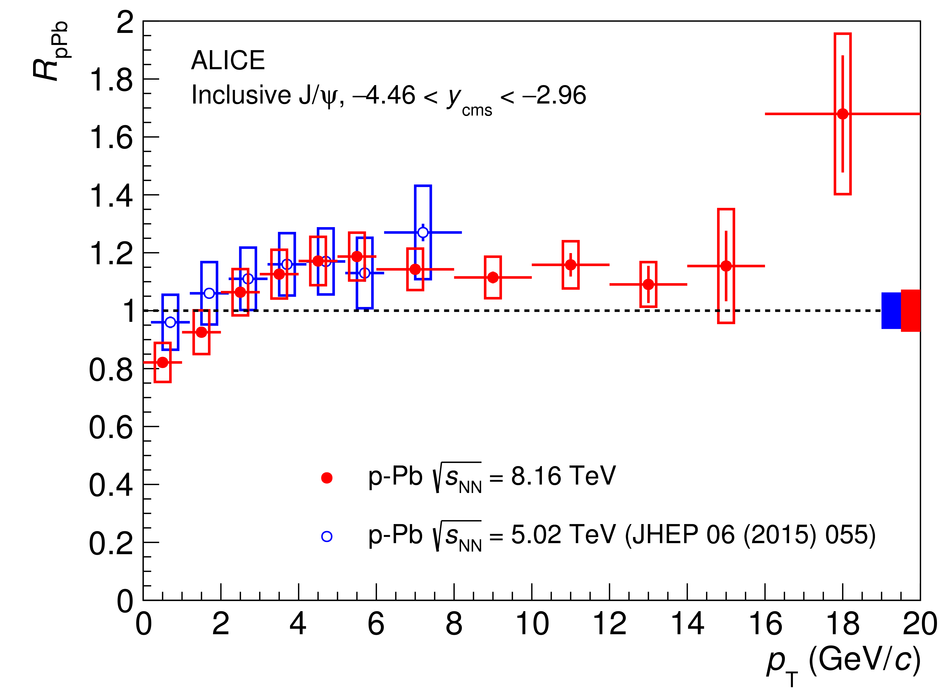
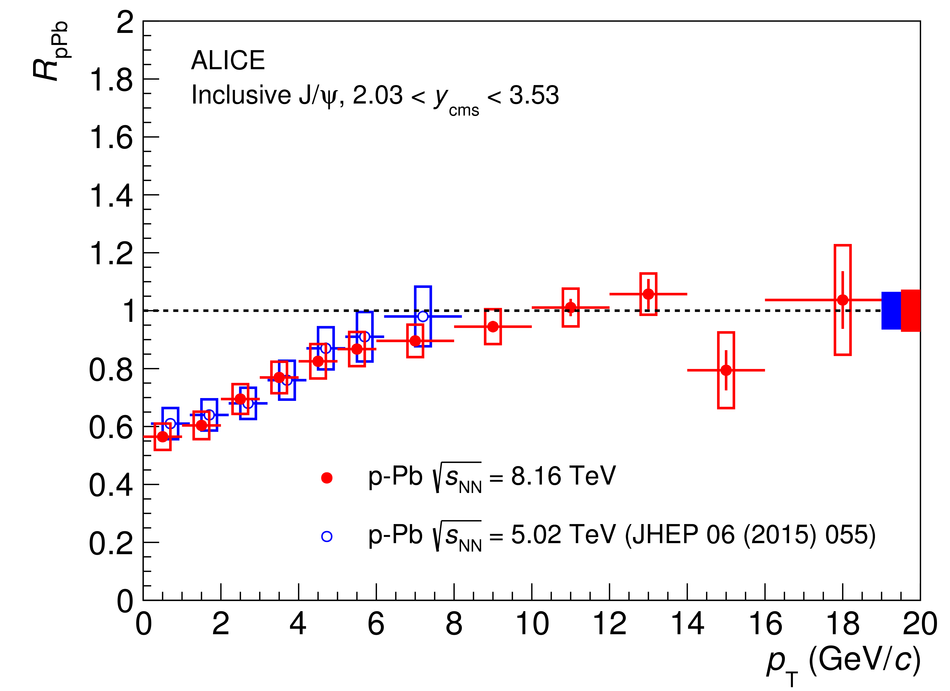
The inclusive J/$\psi$ nuclear modification factor in \mbox{Pb--p} (left) and \mbox{p--Pb} (right) collisions at $\sqrt{s_{\rm NN}}=8.16$ TeV, as a function of $p_{\rm T}$. The horizontal bars correspond to the bin size. The vertical error bars represent the statistical uncertainties, the boxes around the points the uncorrelated systematic uncertainties. Correlated uncertainties are shown as a filled box around unity for each energy. The results are compared with those for \mbox{p--Pb} and \mbox{Pb--p} collisions at $\sqrt{s_{\rm NN}}=5.02$ TeV . The latter have been plotted at a slightly shifted $p_{\rm T}$, for better visibility.

Figure 6

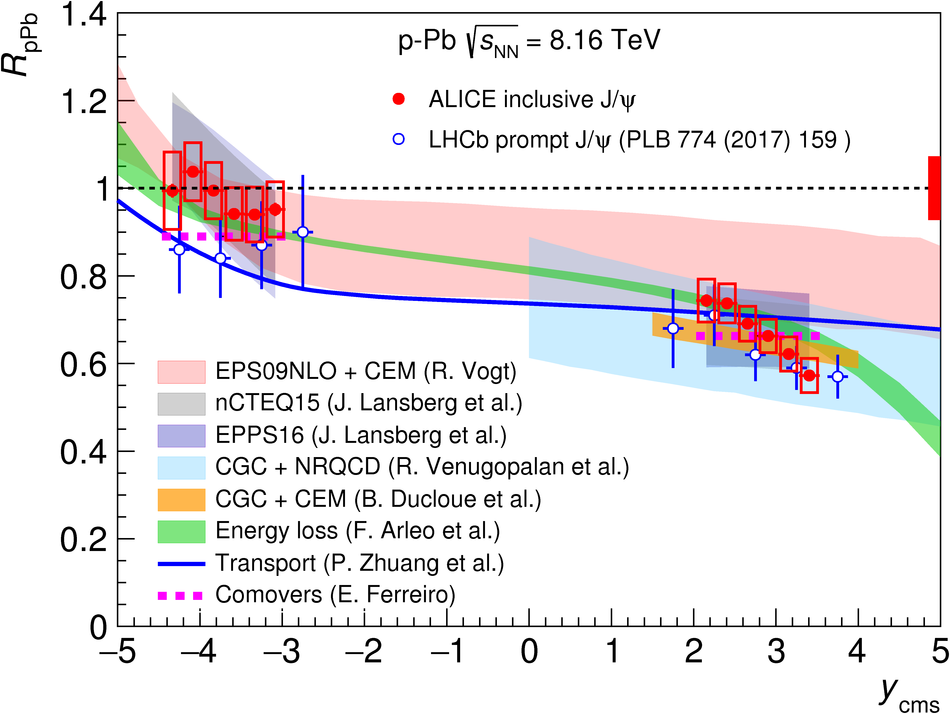
Comparison of the ALICE and LHCb  results on the $y_{\rm cms}$-dependence of the J/$\psi$ nuclear modification factors in \mbox{p--Pb} and \mbox{Pb--p} collisions at $\sqrt{s_{\rm NN}}=8.16$ TeV. The horizontal bars correspond to the bin size. For ALICE, the vertical error bars represent the statistical uncertainties, the boxes around the points the uncorrelated systematic uncertainties, and the filled box around unity the correlated uncertainties. For LHCb, the vertical error bars represent the combination of statistical and systematic uncertainties. The results are also compared to several model calculations  (see text for details).

Figure 7

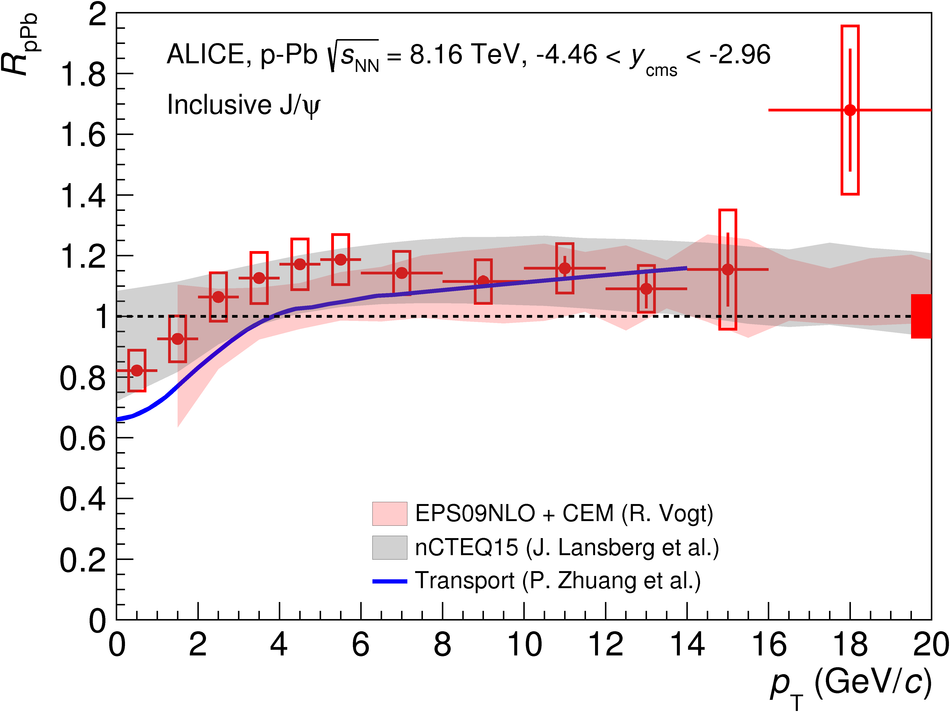
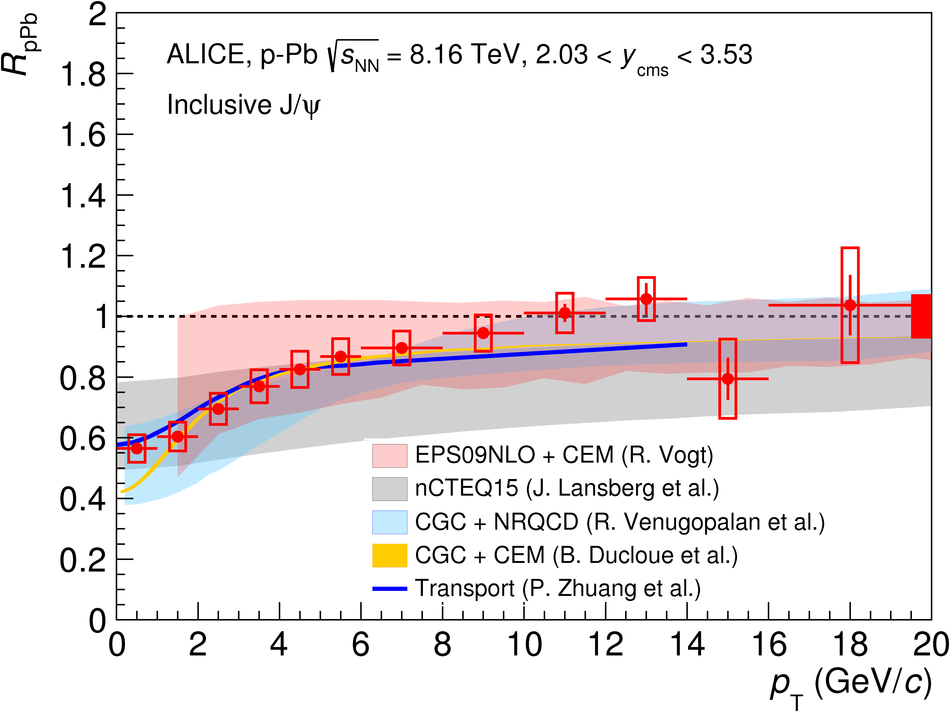
Comparison of the ALICE results on the $p_{\rm T}$-dependence of the inclusive J/$\psi$ nuclear modification factors in \mbox{Pb--p} (left) and \mbox{p--Pb} (right) collisions at $\sqrt{s_{\rm NN}}=8.16$ TeV with model calculations  (see text for details). The horizontal bars on the experimental points correspond to the bin size. The vertical error bars represent the statistical uncertainties, the boxes around the points the uncorrelated systematic uncertainties and the filled box around unity the correlated uncertainties.

Figure 8

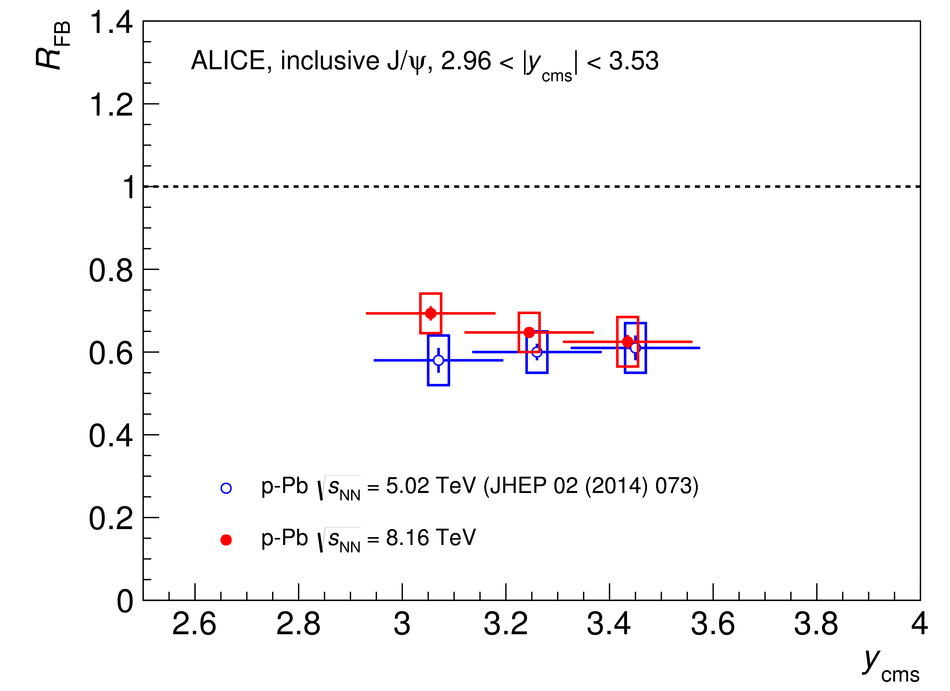
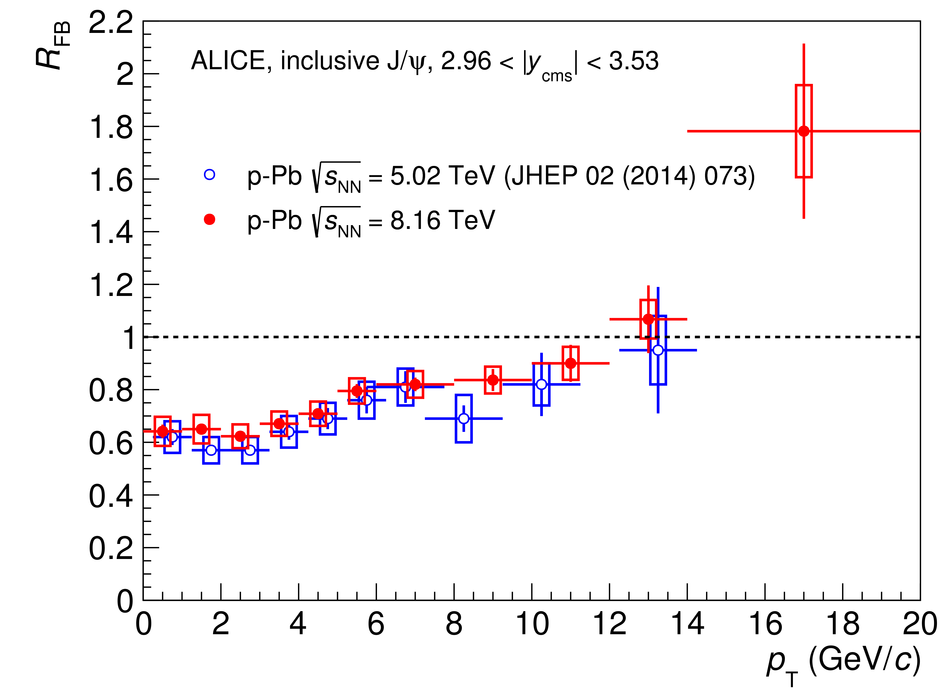
The ratio $R_{\rm FB}$ between the inclusive J/$\psi$ nuclear modification factors, as a function of $y_{\rm cms}$ (left) and $p_{\rm T}$ (right), relative to $2.96< |y_{\rm {cms}}|< 3.53$. The horizontal bars correspond to the bin size. The vertical error bars represent the statistical uncertainties, the boxes around the points the systematic uncertainties. The results are compared with those obtained at $\sqrt{s_{\rm NN}}=5.02$ TeV . The latter have been plotted at a slightly shifted $y_{\rm cms}$ and $p_{\rm T}$, for better visibility.